. 2008 Oct 2;3(10):e3316.
doi: 10.1371/journal.pone.0003316.

Egr-1 regulates autophagy in cigarette smoke-induced chronic obstructive pulmonary disease

Affiliations

Egr-1 regulates autophagy in cigarette smoke-induced chronic obstructive pulmonary disease

Zhi-Hua Chen et al. PLoS One. .

Abstract

Background: Chronic obstructive pulmonary disease (COPD) is a progressive lung disease characterized by abnormal cellular responses to cigarette smoke, resulting in tissue destruction and airflow limitation. Autophagy is a degradative process involving lysosomal turnover of cellular components, though its role in human diseases remains unclear.

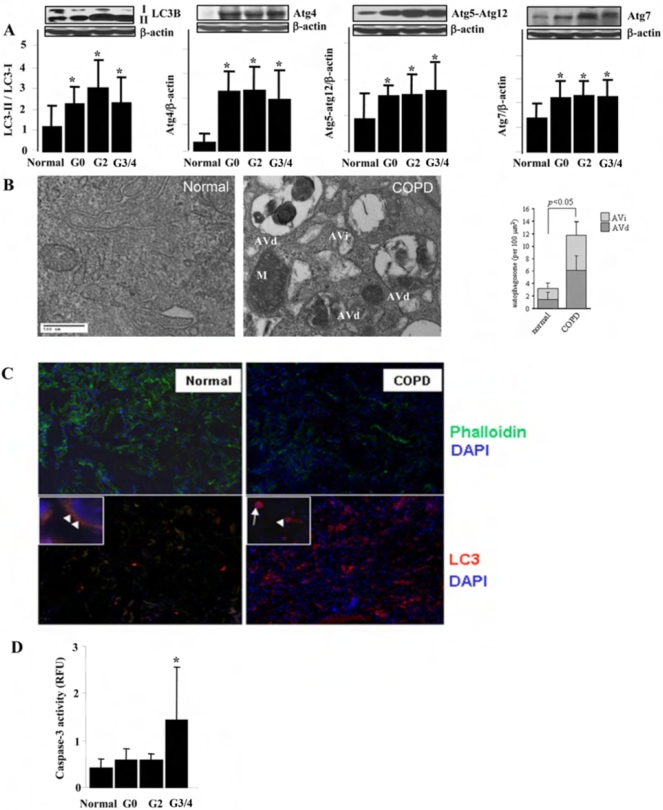
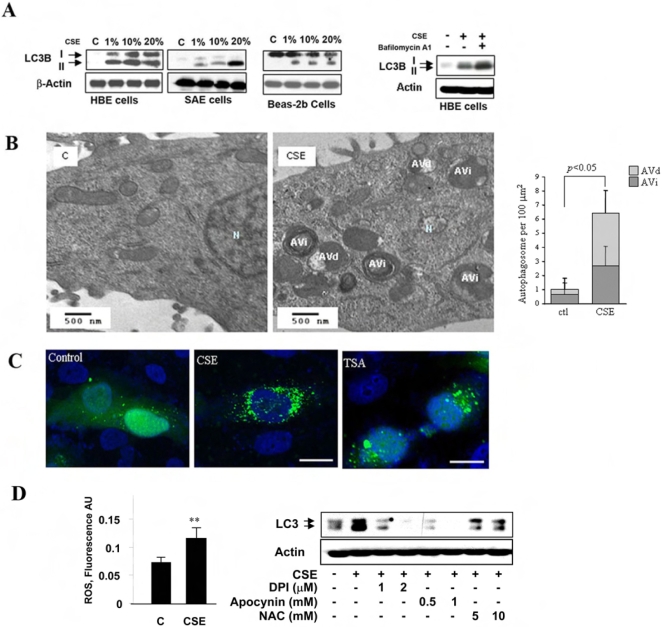
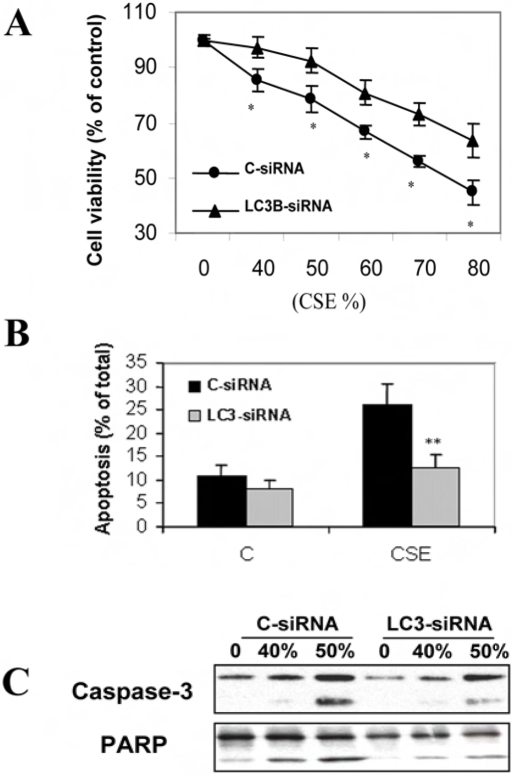
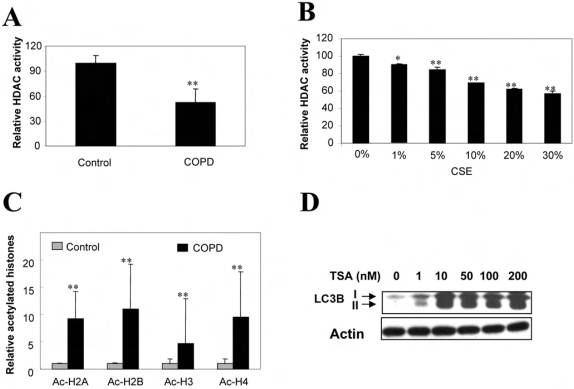
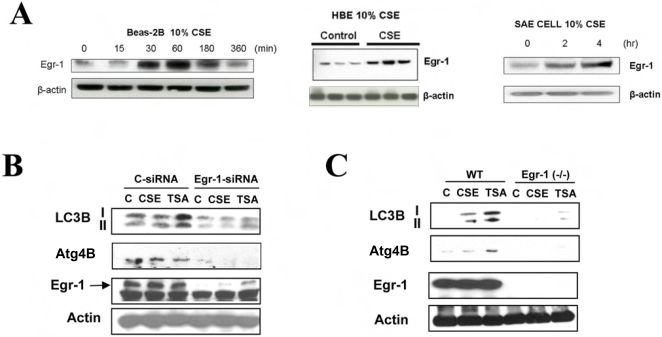
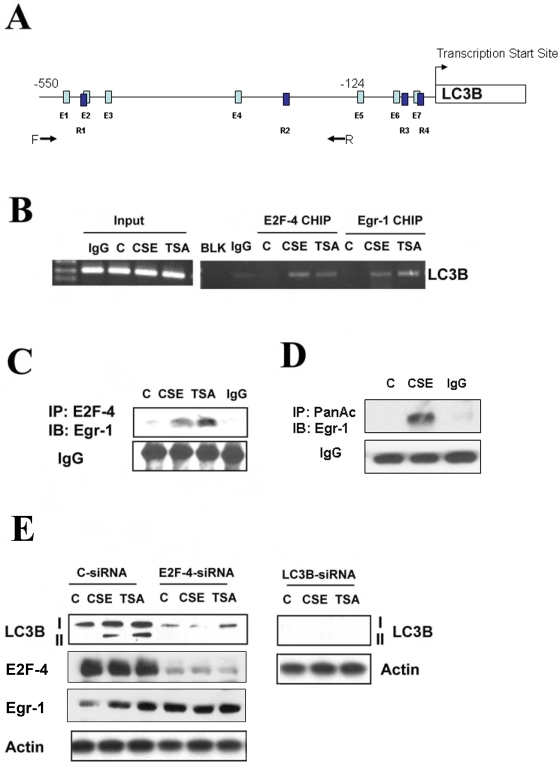
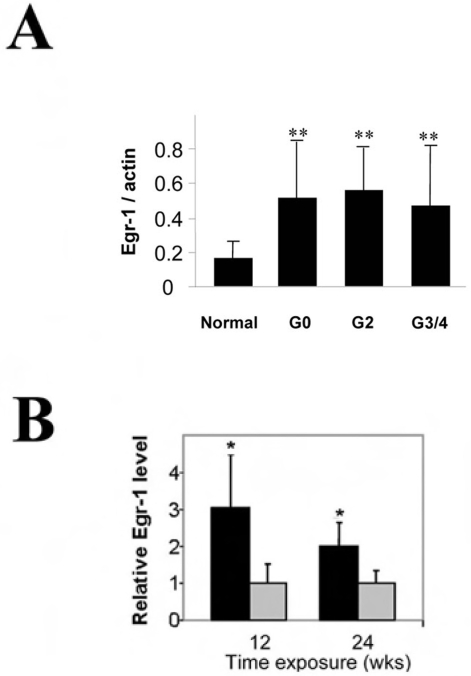
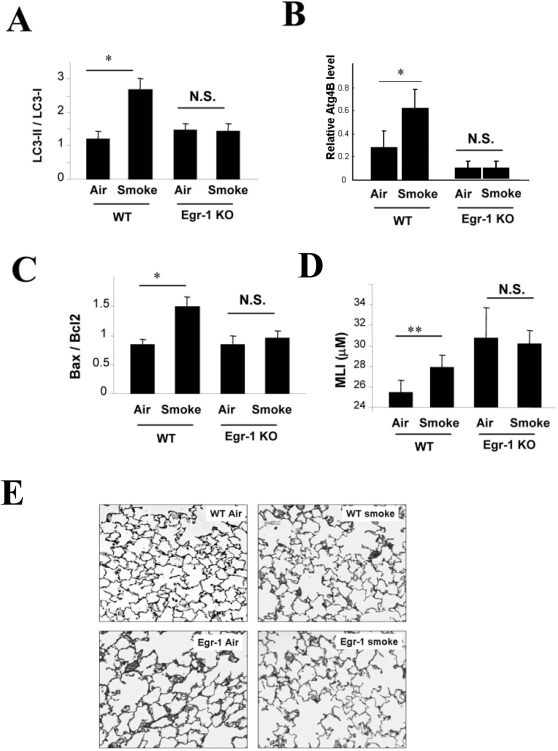
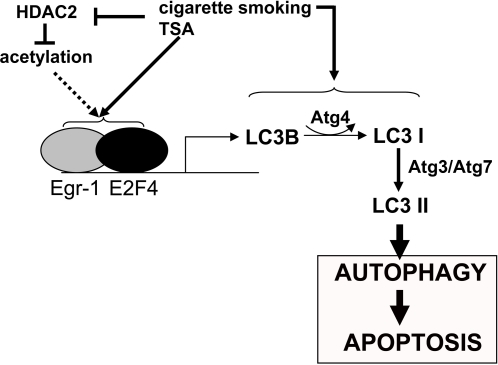
Methodology and principal findings: Increased autophagy was observed in lung tissue from COPD patients, as indicated by electron microscopic analysis, as well as by increased activation of autophagic proteins (microtubule-associated protein-1 light chain-3B, LC3B, Atg4, Atg5/12, Atg7). Cigarette smoke extract (CSE) is an established model for studying the effects of cigarette smoke exposure in vitro. In human pulmonary epithelial cells, exposure to CSE or histone deacetylase (HDAC) inhibitor rapidly induced autophagy. CSE decreased HDAC activity, resulting in increased binding of early growth response-1 (Egr-1) and E2F factors to the autophagy gene LC3B promoter, and increased LC3B expression. Knockdown of E2F-4 or Egr-1 inhibited CSE-induced LC3B expression. Knockdown of Egr-1 also inhibited the expression of Atg4B, a critical factor for LC3B conversion. Inhibition of autophagy by LC3B-knockdown protected epithelial cells from CSE-induced apoptosis. Egr-1(-/-) mice, which displayed basal airspace enlargement, resisted cigarette-smoke induced autophagy, apoptosis, and emphysema.

Conclusions: We demonstrate a critical role for Egr-1 in promoting autophagy and apoptosis in response to cigarette smoke exposure in vitro and in vivo. The induction of autophagy at early stages of COPD progression suggests novel therapeutic targets for the treatment of cigarette smoke induced lung injury.


Conflict of interest statement

Competing Interests: The authors have declared that no competing interests exist.

Figures

Figure 1
Figure 1. Autophagy and apoptosis in Lung Tissues from COPD Patients.
(A) Western blot analysis and corresponding quantification of autophagy related proteins, LC3-II/LC3-I, Atg4, Atg5-atg12 and Atg7, in human lung tissues from normal and COPD patients. Images are representative blots of the corresponding proteins. The sample numbers analyzed by densitometry for each group are: Normal (n = 12), G0 (n = 12), G2 (n = 12), G3/4 (n = 20). β-Actin served as the standard. (B) Representative EM study of human lung sections from a nonsmoker or COPD patient. M indicates mitochondria. AVi indicates immature autophagic vacuoles (autophagosomes). AVd indicates degradative, late autophagic vacuoles (autolysosomes). (Insert, Right) Peripheral lung epithelial cells were scored for number of immature autophagic vacuole (AVi) and degradative autophagic vacuoles (AVd). The data are represented as AVi and AVd per 100 µm2. Data are mean scores plus standard deviation. N = 30 images representative of COPD lung, and N = 15 images representative of control, at same magnification. *P<0.05 (C) Representative immunofluorescence staining of human lung sections from normal and COPD patient. Upper two images are tissues stained with Phalloidin (green), indicating the lung alveolar structure. Lower two images are tissues stained with LC3 (red). Images are at 200× and 600× (insets). White arrow indicates the immune cells and white arrowhead indicates epithelial cells. (D) Caspase-3 activity of lung tissues from normal and various stages of COPD patients (n = 10). (B, D) Data represent mean+/−S.D. *indicates P<0.05, ** indicates P<0.01.
Figure 2
Figure 2. Increased Autophagy by CSE in Pulmonary Epithelial Cells.
(A) Western blot analysis of LC3 in CSE-treated HBE, SAE, and Beas-2B cells. Cells were treated with various concentrations of CSE for 24 h. Far right panel shows that bafilomycin A1 enhanced the CSE-induced LC3 expression in HBE cells. Cells were pretreated with 200 nM Bafilomycin A1 for 30 min and followed by the exposure to 30% CSE for an additional 24 h. (B) Formation of autophagic vacuoles in HBE cells treated with 1% CSE for 4 h. N indicates nuclei. AVi, immature autophagic vacuoles (autophagosomes), AVd, degradative, late autophagic vacuoles (autolysosomes). (Right) EM images corresponding to HBE cell exposed to 10% CSE for 24 h scored for number of immature autophagic vacuole (AVi) and degradative autophagic vacuoles (AVd). The data are represented as AVi and AVd per 100 µm2. Data are mean scores plus standard deviation. N = 15 images representative of CSE treated cells, and N = 10 images representative of control cells, at same magnification. *P<0.05 (C) Representative images of the punctuated GFP-LC3 in Beas-2B cells treated with 5% CSE or 50 nM TSA for 24 h. White bar indicates 10 µm. (D) Increased ROS accumulation in CSE-treated Beas-2B cells. Cells were exposed to 20% CSE for 1 h. (Right) CSE-induced LC3 expression was attenuated by diphenyliodonium (DPI), Apocynin or N-acetyl-L-cysteine (NAC). Beas-2B cells were pretreated with the antioxidant at the indicated concentrations for 30 min and followed by the exposure to 30% CSE for an additional 24 h. Data represent mean+/−S.D. of three independent experiments. ** indicates P<0.01.
Figure 3
Figure 3. Relationship of autophagy to epithelial cell death.
(A–C) Beas-2B cells were pretreated with C-siRNA or LC3-siRNA for 48 h followed by exposure to the indicated concentrations of CSE for an additional 24 h. Cells were then subjected to MTT assay (A), Annexin-V staining (B) or Western blot analysis (C). (A) LC3-siRNA attenuated CSE-induced cytotoxicity in Beas-2B cells. (B) LC3-siRNA inhibited CSE-induced apoptosis in Beas-2B cells. (C) LC3-siRNA attenuated CSE-induced caspase-3 activation and PARP cleavage. (A, B) Data represent mean±SD, (n = 3, * indicates P<0.05 and ** indicates P<0.01 compared with the corresponding control data).
Figure 4
Figure 4. Role of HDAC Activity in COPD and Autophagy.
(A) Decreased HDAC activity in lung tissues from COPD patients (n = 5). (B) CSE-dependent reduction of HDAC activity in Beas-2B cells. Cells were treated with various concentrations of CSE for 24 h and subjected for analysis of HDAC activity. (C) Western blot analysis of acetylated histones in human lung tissues. (D) Induction of LC3 by TSA in Beas-2B cells. Cells were treated with the indicated concentrations of TSA for 24 h. (B–C) Data represent mean+/−S.D. of three independent experiments. *indicates P<0.05, ** indicates P<0.01.
Figure 5
Figure 5. Expression of LC3B requires Egr-1.
(A) Beas-2B, HBE, or SAE cells were treated with 10% CSE, for the times indicated and assayed for the expression of Egr-1 by Western immunoblot analysis. Images are representative of 3 independent experiments. (B) Beas-2B cells were pretreated with control siRNA (C-siRNA), or Egr-1 siRNA for 48 h, followed by the treatment with 20% CSE or 100 nM TSA for an additional 24 h. Cells were then harvested for Western blot analysis. β-Actin served as the standard. (C) Lung fibroblasts derived from wild type C57BL/6 or Egr-1−/− mice were treated with 20% CSE or 100 nM TSA for 24 h. Lysates were analyzed by Western immunoblotting for LC3, or Egr-1. β-Actin served as the standard.
Figure 6
Figure 6. Regulation of LC3B by Egr-1 and E2F-4.
(A) Putative Egr1 and E2F4 binding sites in the LC3b promoter. PCR primer locations for the CHIP analysis are labeled by arrows. Putative E2F4 (E1 to E7) and Egr1 (R1 to R4) binding sites are indicated as light and dark blue bars, respectively. The nucleotide locations for putative E2F1 and Egr1 sites are shown in Figure S1. (B) Increased DNA binding of E2F-4 and Egr-1 to the LC3B promoter by CSE and TSA. Beas-2B cells were treated with 20% CSE or 100 nM TSA for 1 h and subjected to CHIP assay as described in Methods. Chromatin samples were immunoprecipitated with anti-E2F-4 or anti-Egr-1 and evaluated for factor binding to the LC3B promoter region. (C) Beas-2B cells were treated with 20% CSE or 100 nM TSA for 1 h. Lysates were immnuoprecipitated (IP) with anti-E2F-4 and immunoblotted (IB) with anti-Egr-1. IgG served as the standard. CSE and TSA increased E2F-4 and Egr-1 complex formation. (D) Beas-2B cells were treated with 20% CSE for 24 h. Lysates were immunoprecipitated (IP) with anti-pan acetyl antibody and immunoblotted (IB) with anti-Egr-1. IgG served as the standard. CSE increased acetylation of Egr-1. (E) Effect of E2F-4 on the CSE- and TSA-induced LC3B expression. Beas-2B cells were pretreated with control siRNA (C-siRNA), E2F-4-siRNA, LC3B siRNA for 48 h, followed by the treatment with 20% CSE or 100 nM TSA for an additional 24 h. Cells were then harvested for Western blot analysis. β-Actin served as the standard.
Figure 7
Figure 7. Expression of Egr-1 in vitro and in vivo in response to cigarette smoke.
(A) Lung tissue samples from various stages of COPD (GOLD0 to GOLD3/4) were analyzed for expression of Egr-1 in lung tissue by Western immunoblot analysis, and normalized to β-actin expression. (B) C57BL/6 were exposed to chronic cigarette smoke exposure (black bars) or air (grey bars) for 12 or 24 weeks and Egr-1 expression in the lung was determined by Western immunoblot analysis. β-Actin served as the standard. (n = 12). *indicates P<0.05, **indicates P<0.01. N.S., not significant.
Figure 8
Figure 8. Role of Egr-1 in the regulation of autophagy, apoptosis, and emphysema in vivo during chronic cigarette smoke exposure.
(A–C) Wild type C57BL/6 or Egr-1 −/− mice were exposed to chronic cigarette smoke exposure for 6 months (each group n = 5). Lung tissue homogenates were analyzed for (A) expression of LC3, (B) expression of Atg4B, (C) Bax/Bcl2 ratio. Lung tissue was evaluated for emphysema/airspace enlargement and mean linear intercept (D) and H+E staining (E).
Figure 9
Figure 9. Epigenetic regulation of autophagy by cigarette smoking.
The scheme shows the proposed pathway for epigenetic regulation of autophagy by cigarette smoke exposure. Suppression of HDAC activity leads to the increased transcription of the LC3B promoter by E2F/Egr-1 factors.

References

    1. Celli BR, MacNee W ATS/ERS Task Force. Standards for the diagnosis and treatment of patients with COPD: a summary of the ATS/ERS position paper. Eur Respir J. 2004;23:932–946. - PubMed
    1. Barnes PJ. Chronic obstructive pulmonary disease. N Engl J Med. 2000;343:269–280. - PubMed
    1. Mayer AS, Newman LS. Genetic and environmental modulation of chronic obstructive pulmonary disease. Respir Physiol. 2001;128:3–11. - PubMed
    1. Barnes PJ, Shapiro SD, Pauwels RA. Chronic obstructive pulmonary disease: molecular and cellular mechanisms. Eur Respir J. 2003;22:672–688. - PubMed
    1. Wang IM, Stepaniants S, Boie Y, Mortimer JR, Kennedy B, et al. Gene expression profiling in patients with chronic obstructive pulmonary disease and lung cancer. Am J Respir Crit Care Med. 2007;177:402–411. - PubMed

Publication types

Substances