. 2008 Oct 2;3(10):e3329.
doi: 10.1371/journal.pone.0003329.

Evolution of the aging brain transcriptome and synaptic regulation

Affiliations

Evolution of the aging brain transcriptome and synaptic regulation

Patrick M Loerch et al. PLoS One. .

Abstract

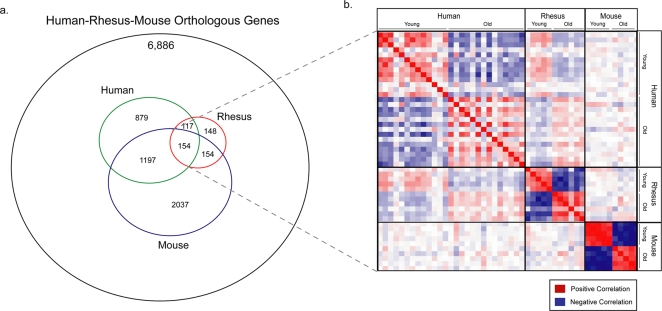
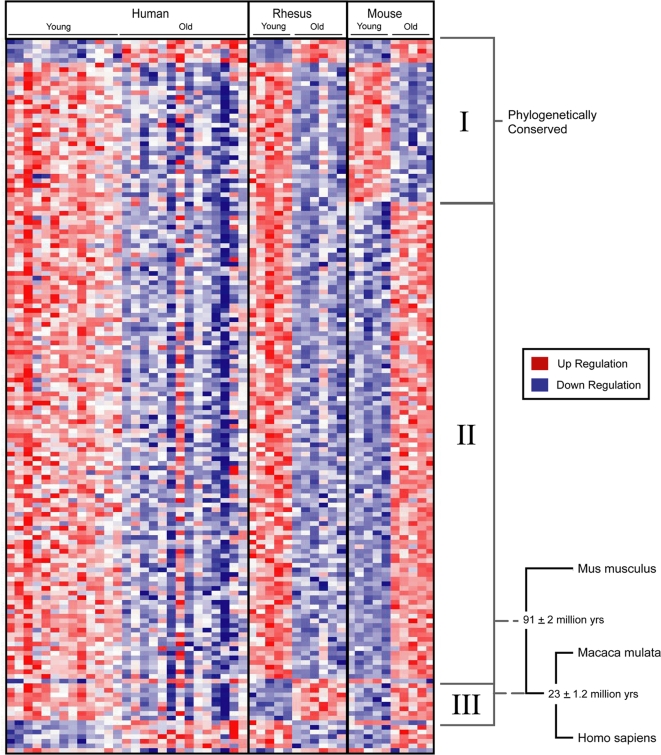
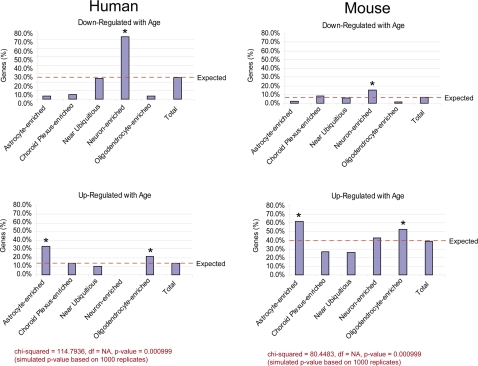
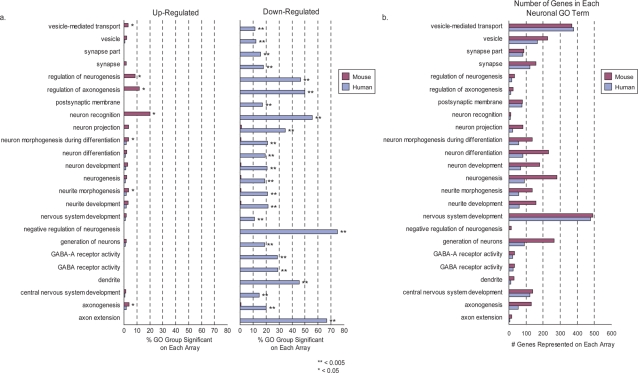
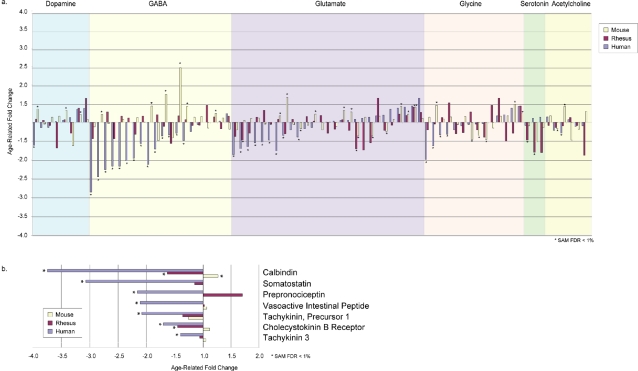
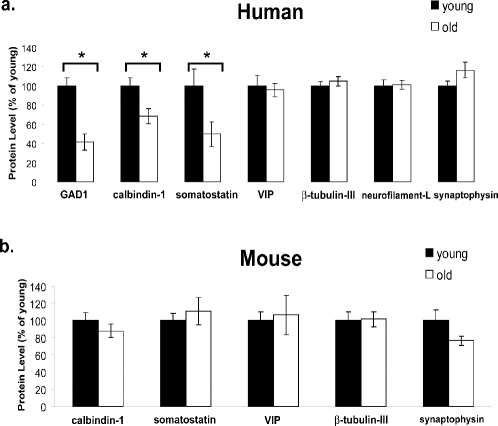
Alzheimer's disease and other neurodegenerative disorders of aging are characterized by clinical and pathological features that are relatively specific to humans. To obtain greater insight into how brain aging has evolved, we compared age-related gene expression changes in the cortex of humans, rhesus macaques, and mice on a genome-wide scale. A small subset of gene expression changes are conserved in all three species, including robust age-dependent upregulation of the neuroprotective gene apolipoprotein D (APOD) and downregulation of the synaptic cAMP signaling gene calcium/calmodulin-dependent protein kinase IV (CAMK4). However, analysis of gene ontology and cell type localization shows that humans and rhesus macaques have diverged from mice due to a dramatic increase in age-dependent repression of neuronal genes. Many of these age-regulated neuronal genes are associated with synaptic function. Notably, genes associated with GABA-ergic inhibitory function are robustly age-downregulated in humans but not in mice at the level of both mRNA and protein. Gene downregulation was not associated with overall neuronal or synaptic loss. Thus, repression of neuronal gene expression is a prominent and recently evolved feature of brain aging in humans and rhesus macaques that may alter neural networks and contribute to age-related cognitive changes.


Conflict of interest statement

Competing Interests: The authors have declared that no competing interests exist.

Figures

Figure 1
Figure 1. Genome-wide comparison of brain aging in humans, rhesus macaques, and mice.
a. Venn diagram indicating the extent of overlap in age-related gene expression changes between the three species. The size of each circle corresponds to the number of age-related expression changes in each species. b. A group of 154 common aging genes provides an indicator of biological aging in all three species. Shown is a matrix of Pearson correlation coefficients that indicate the degree of overall similarity between any two samples (see Methods). Positively correlated sample pairs are indicated by red and negatively correlated pairs are indicated by blue. The degree of correlation correlates with color intensity. The species and age groups are indicated (Human: young ≤40 years; aged ≥70 years. Rhesus macaque: young 5–6 years; aged 28–31 years. Mouse: young 5 months; aged 30 months).
Figure 2
Figure 2. Age-regulated genes common to humans, rhesus macaques, and mice.
The transcriptional profiles of genes that are age-regulated in all three species were analyzed by hierarchical clustering. Reduced expressed with aging is indicated by a transition from red in the young to blue in the aged, and vice versa. Genes separate into three groups based on whether the direction of age-related changes (i.e., age-upregulated or age-downregulated) is conserved in all three species (category I), changes between mice and rhesus macaques (category II), or changes between rhesus macaques and humans (category III). Also indicated is the evolutionary time of divergence in years for each pair of species based on analysis of protein sequence alignments .
Figure 3
Figure 3. Cell type localization of gene expression in the aging cortex.
Genes enriched in specific cortical cell types, based on the Allen Brain Atlas, were analyzed in the aging mouse and human gene expression profiles. The percentage of age-regulated genes enriched in each cell type is represented by the Y-axis was determined as described in Methods. The expected percentages are indicated by the dashed line. Statistically significant cell type enrichment was determined using a Chi-square test with a permutation-based p-value (1,000 replicates). Specific cell types that exhibit a statistically significant change in age-regulated genes are indicated by an asterisk.
Figure 4
Figure 4. Neuronal gene ontology groups distinguish the expression profiles of the aging human and mouse cortex.
a. Neuronal gene ontology (GO) groups that are significantly enriched (p-value≤0.005; binomial approximated p-value for a hypergeometric distribution) for age-related expression changes (SAM comparison, FDR≤0.01) were identified. The X-axis represents the percentage of genes in a GO group with age-related up- or down-regulation. Multiple neuronal GO groups are enriched in the human aging profile; while only a few neuronal GO terms appear at less significant thresholds in the mouse aging profile. Age-upregulated and age-downregulated genes are shown separately. b. Number of genes in each GO group that are represented on the mouse and human microarray platforms.
Figure 5
Figure 5. Global repression of genes associated with GABA-mediated inhibitory neurotransmission.
Shown are age-related changes in the expression of genes that mediate major neurotransmitter systems in the cortex of humans, rhesus monkeys, and mice. a. Genes involved in specific neurotransmitters were identified based on membership in the corresponding GO groups. Age-related fold changes in genes with orthologs in all three species and represented on all three microarray platforms are shown for humans, rhesus monkeys, and mice. Gene identities are provided in Table S11. *q-value≤0.01. b. Age-related fold changes for markers of inhibitory neuronal subpopulations. Statistical significance in a specific species (q-value≤0.01) is denoted with an asterisk.
Figure 6
Figure 6. Reduced protein markers of inhibitory neurons in the aged human cortex.
a. GAD1, calbindin-1, and somatostatin protein levels are significantly lower in the aged (71–91 yr; white) human cortex than in the young adult (24–35 yr; black) cortex, in agreement with microarray results. VIP expression is age-stable at the protein level. The neuronal markers β-tubulin-III and neurofilament-L are age-stable at the protein level, as is the synaptic protein synaptophysin. n = 15. The primary Western blot data are shown in Figure S2a. b. Calbindin-1, somatostatin, and VIP protein levels are age-stable in the mouse cortex, in agreement with the microarray results. Likewise, β-tubulin-III and synaptophysin do not change significantly with age. Attempts to probe for mouse GAD1 and neurofilament-L were not successful. n = 6. The primary Western blot data are shown in Figure S2b. In both a and b, the level of each protein was normalized to the level of actin. Values represent the mean±S.E.M. expressed as percent of the mean young value for each protein. * P<0.05 by Student's two-tailed t-test.

Similar articles

Cited by

References

    1. Martin GM. Genetic modulation of senescent phenotypes in Homo sapiens. Cell. 2005;120:523–532. - PubMed
    1. Yankner BA, Lu T, Loerch P. The Aging Brain. Annu Rev Pathol. 2007;3:41–66. - PubMed
    1. Fischer A, Sananbenesi F, Wang X, Dobbin M, Tsai LH. Recovery of learning and memory is associated with chromatin remodelling. Nature. 2007;447:178–182. - PubMed
    1. Lee CK, Weindruch R, Prolla TA. Gene-expression profile of the ageing brain in mice. Nat Genet. 2000;25:294–297. - PubMed
    1. Jiang CH, Tsien JZ, Schultz PG, Hu Y. The effects of aging on gene expression in the hypothalamus and cortex of mice. Proc Natl Acad Sci U S A. 2001;98:1930–1934. - PMC - PubMed

Publication types