. 2008 Nov;48(5):1396-403.
doi: 10.1002/hep.22508.

Fatty acid synthase is up-regulated during hepatitis C virus infection and regulates hepatitis C virus entry and production

Affiliations

Fatty acid synthase is up-regulated during hepatitis C virus infection and regulates hepatitis C virus entry and production

Wei Yang et al. Hepatology. 2008 Nov.

Abstract

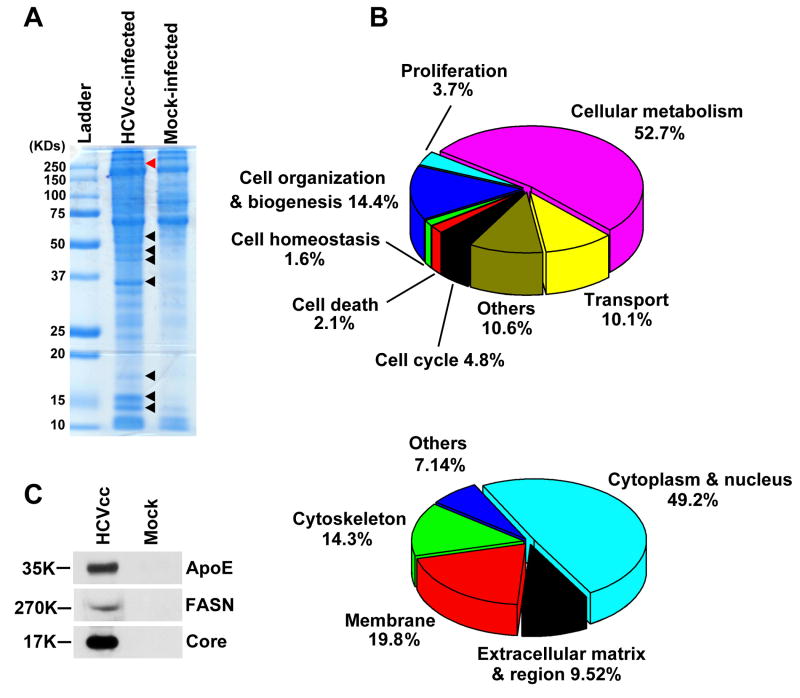
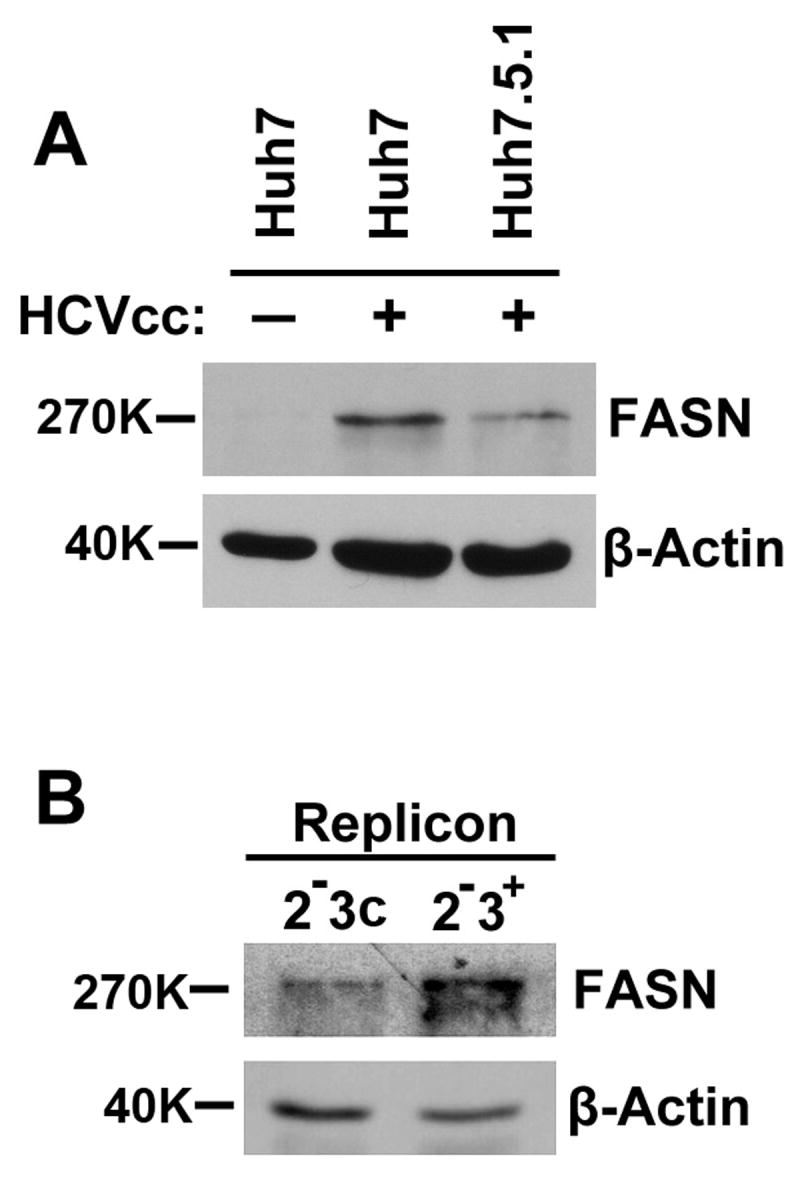
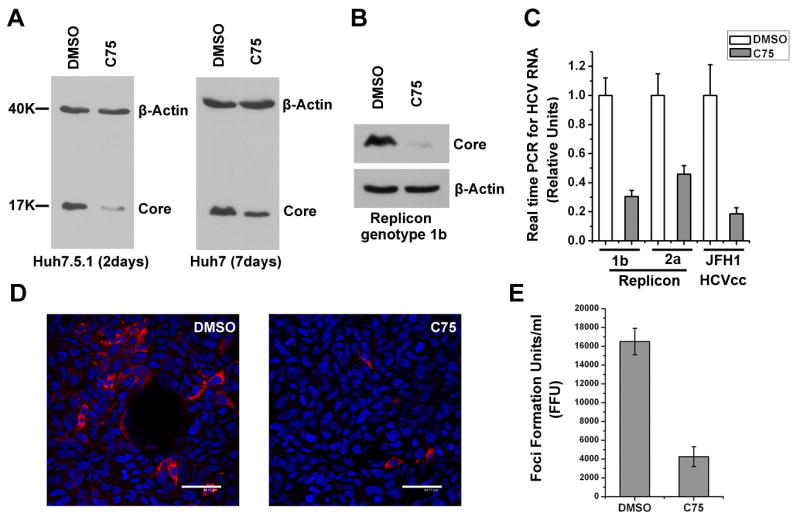
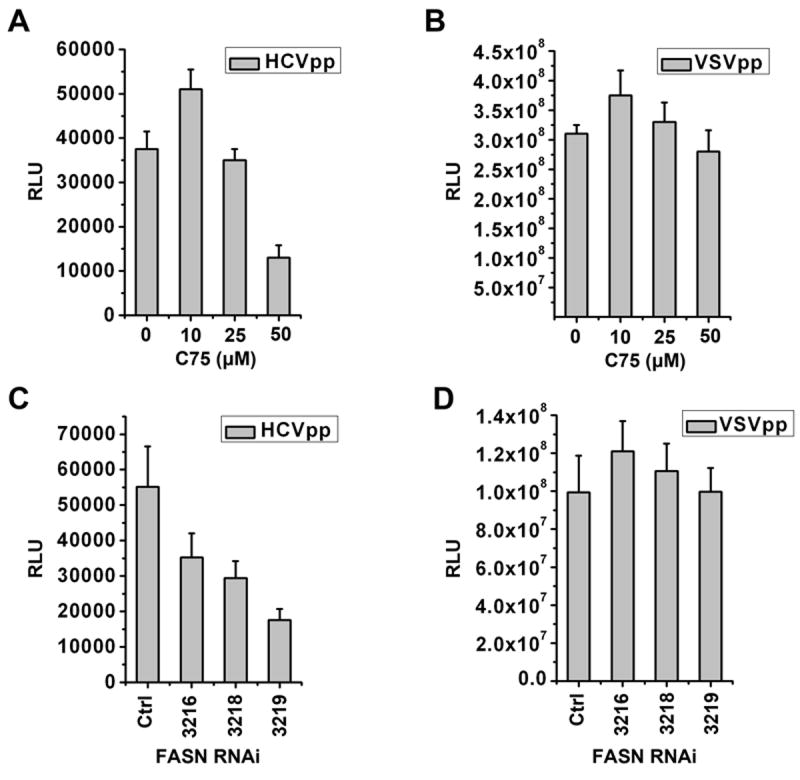
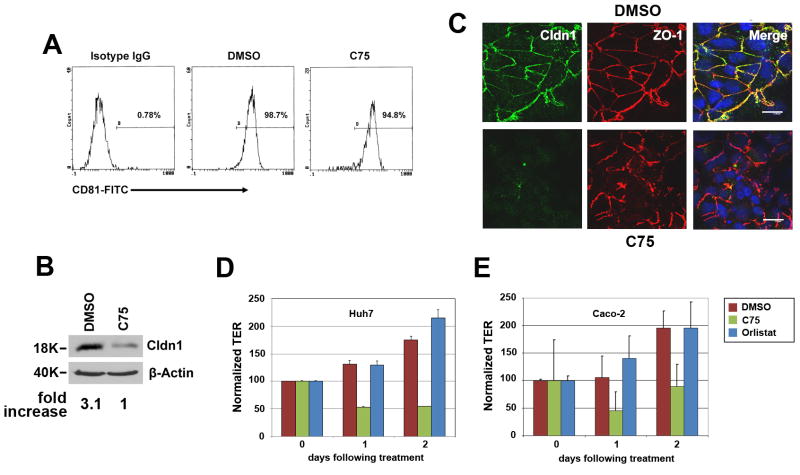
Hepatitis C virus (HCV) is a major human pathogen that causes serious illness, including acute and chronic hepatitis, cirrhosis, and hepatocellular carcinoma. Using a mass spectrometry-based proteomics approach, we have identified 175 proteins from a cell culture supernatant fraction containing the HCV genotype 2a (JFH1) virus, among which fatty acid synthase (FASN), the multifunctional enzyme catalyzing the de novo synthesis of fatty acids, was confirmed to be highly enriched. Subsequent studies showed that FASN expression increased in the human hepatoma cell line, Huh7, or its derivative, upon HCV infection. Blocking FASN activity by C75, a pharmacological FASN inhibitor, led to decreased HCV production. Reduction of FASN by RNA interference suppressed viral replication in both replicon and infection systems. Remarkably, FASN appeared to be selectively required for the expression of claudin-1, a tight junction protein that was recently identified as an entry coreceptor for HCV, but not for the expression of another HCV coreceptor, CD81. The decrease in Claudin-1 expression resulting from FASN inhibition was accompanied by a decrease in transepithelial electric resistance of Huh7 cells, implying a reduction in the relative tightness of the cell monolayer. Consequently, the entry of human immunodeficiency virus-HCV pseudotypes was significantly inhibited in C75-treated Huh7 cells.

Conclusion: As far as we know, this is the first line of evidence that demonstrates that HCV infection directly induces FASN expression, and thus suggests a possible mechanism by which HCV infection alters the cellular lipid profile and causes diseases such as steatosis.


Conflict of interest statement

Potential conflict of interest: Nothing to report.

Figures

Figure 1
Figure 1. Identification of supernatant proteins that co-fractionated with HCV virions
(A) Equal volumes of supernatant collected from HCVcc-infected and mock-infected Huh7.5.1 cells were subjected to filtration concentration and sucrose cushion ultracentrifugation. The pellets were dissolved in Laemmli buffer and resolved on a 10% one-dimensional SDS-PAGE gel. Eight representative protein bands differentially expressed between the samples are indicated with arrows and the red arrow points to the position of FASN. (B) Classification by gene ontology of the co-purified proteins with HCV virions in terms of their biological function and subcellular localization. (C) Protein pellets prepared from A were analyzed by western blotting and the presence of ApoE, FASN, and HCV Core protein was only found in the supernatant of HCVcc-infected cells.
Figure 2
Figure 2. Upregulation of FASN in HCVcc infected cells and replicon cells
Cell lysates were prepared from Naïve Huh7 and HCVcc infected Huh7 or Huh7.5.1 cells (A) and from HCV replicon cells harboring a full-length genotype 1b genome (2-3+) or the cured cells (2-3c) (B). 20 μg cell lysates (30 μg for replicon cells) were evaluated by Western blotting using an anti-FASN monoclonal antibody. Detection of β-actin was indicative of protein loading. The basal level of FASN in naïve Huh7.5.1 was virtually undetectable (data not shown) by western blotting.
Figure 3
Figure 3. FASN is required for effective viral replication and production
(A) Huh7 and Huh7.5.1 cells were infected with HCVcc for 7 days or 2 days respectively, and then treated with 50μM C75 or the same volume of DMSO as the negative control for indicated time periods. Cell lysates were prepared for quantification of HCV core expression by Western blotting. Detection of β-actin served as the equal loading control. (B) HCV replicon cells (2-3+) were treated with 50μM C75 or DMSO for 12 h and the Core protein abundance was quantified by Western blotting. (C) Genotype 1b and 2a replicon cells as well as HCVcc-infected Huh7 cells were treated with 50μM C75 or DMSO for 12 h. Intracellular HCV RNA was quantified by real time RT-PCR and relative international units were calculated and plotted by arbitrarily setting that of DMSO treated samples to 1. (D) Cell culture supernatants from DMSO or C75 treated HCVcc-producing Huh7 cells were collected and used to infect naïve Huh7.5.1 cells, which were then fixed and stained for viral Core protein after 48 hours. The nucleus was stained with Draq5 and shown in blue (scale bar = 44 μm). (E) Quantification of foci formation units was plotted in bar graph based on the results from D. Error bars represent standard deviations.
Figure 4
Figure 4. Knockdown of FASN inhibits HCV replication
Three short hairpin RNA vectors (3216, 3218 and 3219) targeting FASN and the control vector (Ctrl) were introduced into genotype 1b replicon cells by lentiviral transduction. Forty-eight hours post transduction the cells were lysed and split into two equivalent sets, one of which was used for western analysis of HCV Core and FASN expressions (A). The other set was used for cellular HCV genomic RNA quantification using quantitative RT-PCR (B). Similar experiments were repeated in a genotype 2a replicon cell line. (C, D) Naïve Huh7 cells were transduced with above shRNAi lentiviral particles and then infected with JFH1 HCVcc (MOI 0.1) for 3 days. HCV Core protein production was determined by Western blotting (C) and viral RNA was quantified by real time RT-PCR and plotted as relative units (D). Error bars represent standard deviations.
Figure 5
Figure 5. Inhibition of FASN blocks HCVpp entry
(A, B) Huh7 cells were treated with indicated concentration of C75 for 12 hours (hrs) and then spin-infected with HCVpp or VSVpp and incubated for additional 2 days followed by a luciferase assay to quantify virus entry. (C, D) Huh7 cells were transduced with 3 shRNAi lentiviruses (3216, 3218, and 3219) targeting FASN and the control shRNAi virus (Ctrl) respectively. Two days after lentiviral transduction, the cells were spin-infected with HCVpp or VSVpp and further incubated for 48 hrs prior to luciferase assay. Error bars represent standard deviations.
Figure 6
Figure 6. Inhibition of FASN decreases CLDN1 expression and the transepithelial electric resistance of Huh7 cells
(A) 106 Huh7 cells were treated with DMSO or C75 (50μM) for 12 hrs and stained with either anti-CD81 (JS-81, BD Bioscience) or a control mouse IgG followed by FITC-secondary antibody staining. Positively stained cells were quantified using a Coulter XL flow cytometer. (B) Huh7 cells were treated with 50μM C75 or the same amount of DMSO for 12 hrs followed by western analysis of CLDN1 expression. The intensity of bands from Western blotting was quantified by using Scion Image version Beta 4.0.3 (scioncorp.com) and confirmed by Photoshop histogram analysis. Fold of increase was indicated by numbers below the image. The results were representative of at least three independent experiments which were normalized against β–Actin level. (C) DMSO (upper panel) or C75 (lower panel) treated Huh7 cells (12 hrs) were fixed and stained for TJ proteins CLDN1 (green) and ZO-1 (red). Nuclei were located by Draq5 staining (blue) (scale bar = 13 μm). (D) 104 Huh7 cells or Caco-2 cells (E) were seeded in a 24-well transwell plate (6.5-mm membrane diameter, 0.4-μm pore size). The cells were allowed to grow for additional 3 days after confluence to reach high TER level and then treated with DMSO, C75 (50μM) or Orlistat (10μM) for 12 hrs. TER values obtained from Day 0 post inhibitor treatment were monitored to establish a baseline resistance and were arbitrarily set to 100. Resistance data collected thereafter were normalized to the initial baseline resistance and plotted as a normalized TER.

References

    1. Evans MJ, von Hahn T, Tscherne DM, Syder AJ, Panis M, Wolk B, Hatziioannou T, et al. Claudin-1 is a hepatitis C virus co-receptor required for a late step in entry. Nature. 2007;446:801–805. - PubMed
    1. Lindenbach BD, Rice CM. Molecular biology of flaviviruses. Adv Virus Res. 2003;59:23–61. - PubMed
    1. Lindenbach BD, Rice CM. Unravelling hepatitis C virus replication from genome to function. Nature. 2005;436:933–938. - PubMed
    1. Penin F, Dubuisson J, Rey FA, Moradpour D, Pawlotsky JM. Structural biology of hepatitis C virus. Hepatology. 2004;39:5–19. - PubMed
    1. Bjornsson E, Angulo P. Hepatitis C and steatosis. Arch Med Res. 2007;38:621–627. - PubMed

Publication types