. 2008 Sep 11;8(12):1.1-23.
doi: 10.1167/8.12.1.

Mobile computation: spatiotemporal integration of the properties of objects in motion

Affiliations

Mobile computation: spatiotemporal integration of the properties of objects in motion

Patrick Cavanagh et al. J Vis. .

Abstract

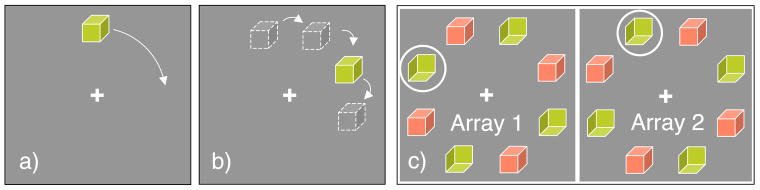
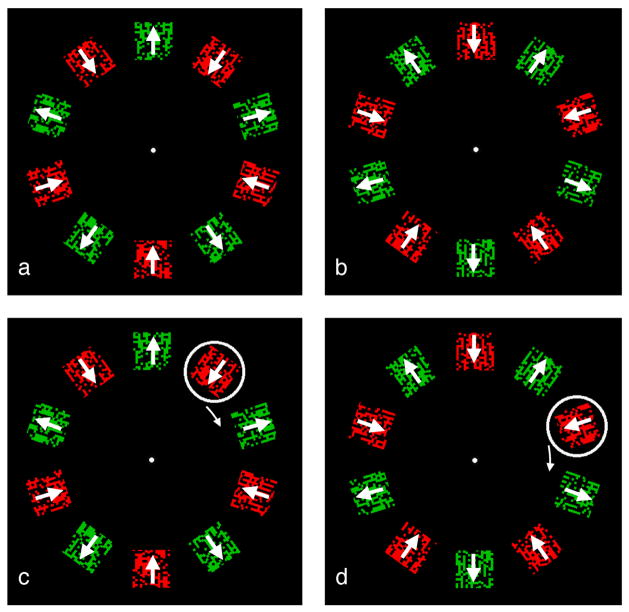
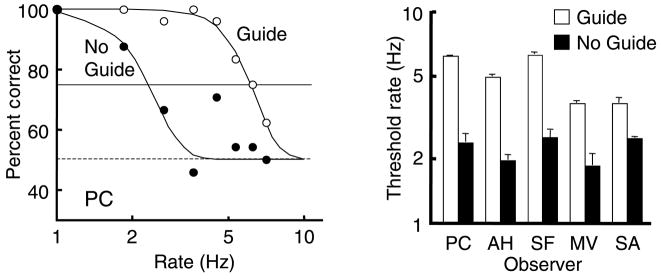
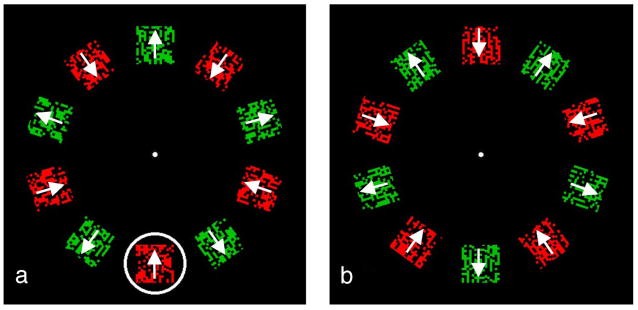
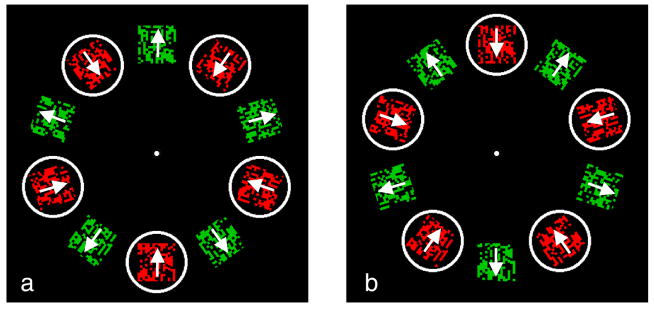
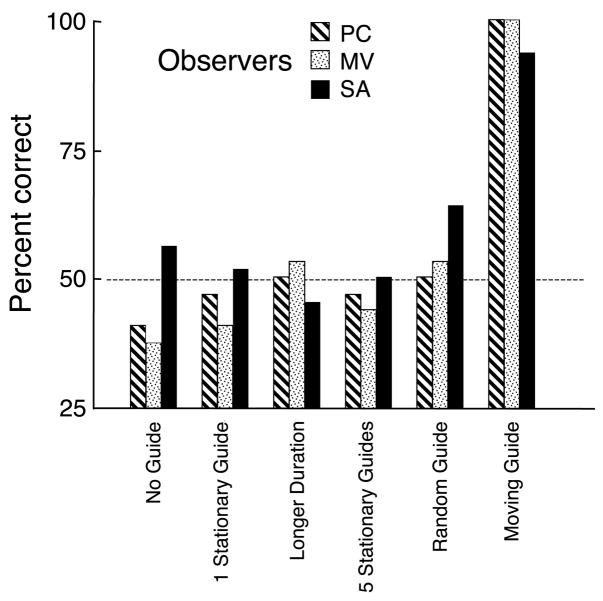
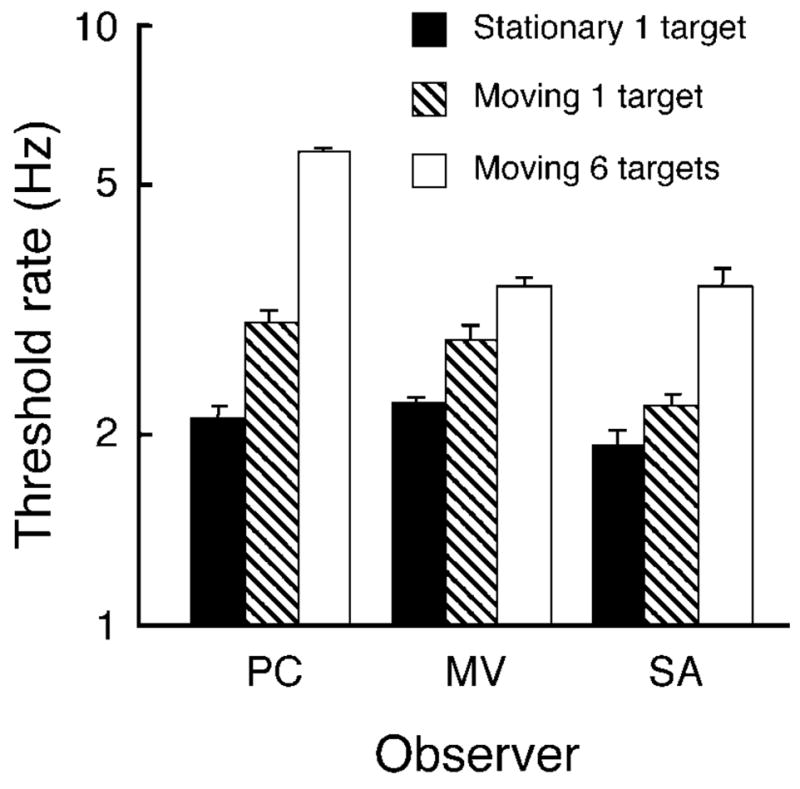
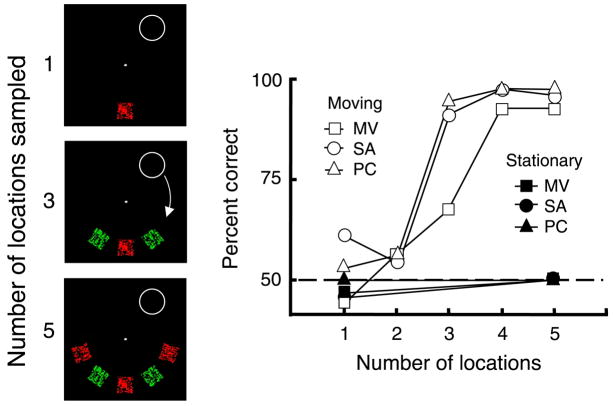
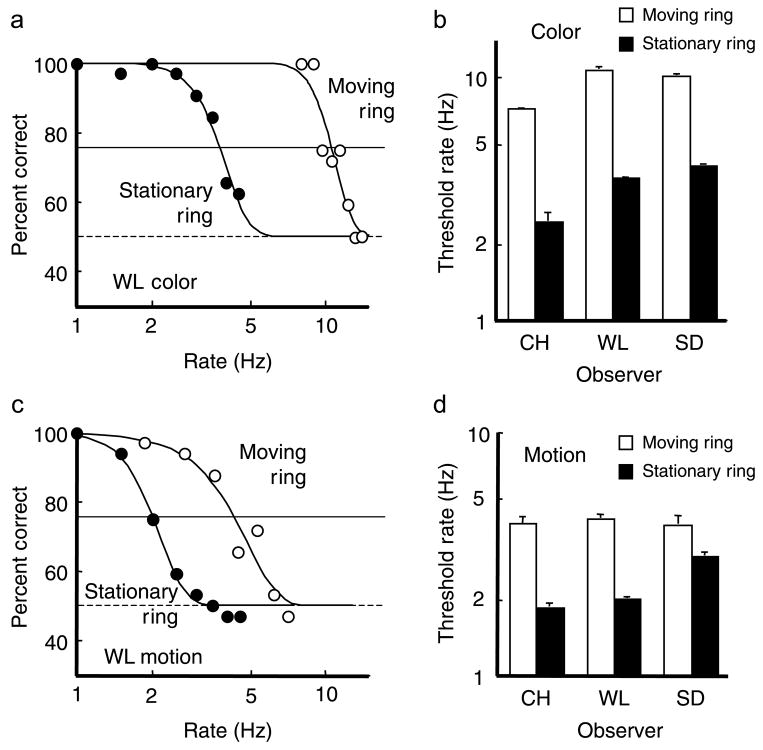
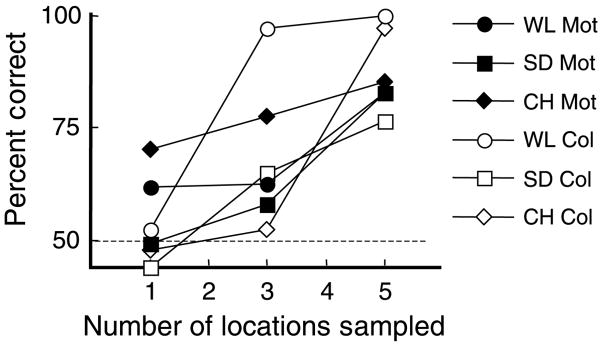
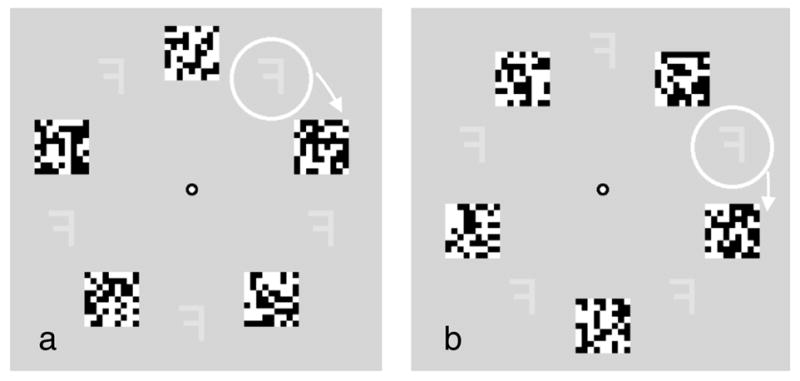
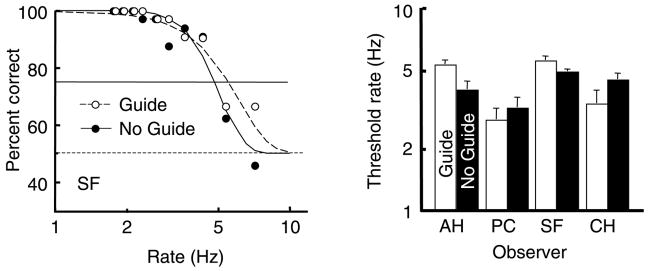
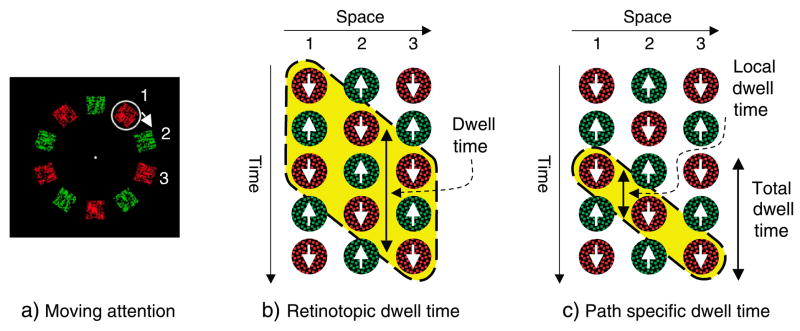
We demonstrate that, as an object moves, color and motion signals from successive, widely spaced locations are integrated, but letter and digit shapes are not. The features that integrate as an object moves match those that integrate when the eyes move but the object is stationary (spatiotopic integration). We suggest that this integration is mediated by large receptive fields gated by attention and that it occurs for surface features (motion and color) that can be summed without precise alignment but not shape features (letters or digits) that require such alignment. Rapidly alternating pairs of colors and motions were presented at several locations around a circle centered at fixation. The same two stimuli alternated at each location with the phase of the alternation reversing from one location to the next. When observers attended to only one location, the stimuli alternated in both retinal coordinates and in the attended stream: feature identification was poor. When the observer's attention shifted around the circle in synchrony with the alternation, the stimuli still alternated at each location in retinal coordinates, but now attention always selected the same color and motion, with the stimulus appearing as a single unchanging object stepping across the locations. The maximum presentation rate at which the color and motion could be reported was twice that for stationary attention, suggesting (as control experiments confirmed) object-based integration of these features. In contrast, the identification of a letter or digit alternating with a mask showed no advantage for moving attention despite the fact that moving attention accessed (within the limits of precision for attentional selection) only the target and never the mask. The masking apparently leaves partial information that cannot be integrated across locations, and we speculate that for spatially defined patterns like letters, integration across large shifts in location may be limited by problems in aligning successive samples. Our results also suggest that as attention moves, the selection of any given location (dwell time) can be as short as 50 ms, far shorter than the typical dwell time for stationary attention. Moving attention can therefore sample a brief instant of a rapidly changing stream if it passes quickly through, giving access to events that are otherwise not seen.


Figures

Figure 1
Figure 1
Apparent motion procedure. (a) A cube moves continuously around the fixation point at a speed too fast for local analysis of its structure to be completed at each location. If the perception of the cube’s 3D shape remains intact, it requires an accumulation of intermediate results in an object-based, position-independent representation. (b) In our procedure we do not use continuous motion but apparent motion where the target makes discrete steps around the fixation point. (c) To restrict the time available for processing at a single location, we present the target at every location alternating rapidly with a second pattern: the green cube in this example alternates with a red cube of a different orientation. We increase the alternation rate until neither cube can be identified (e.g., name the color of the cube whose front faces down to the left) when attending to any one location, ensuring that local processing cannot complete the analysis of the target. Now we add a guide, here a circle, that steps from location to location in phase with the local alternation so that the target (the green cube) is always within the guide which continues around the locations in the array (only two arrays in the sequence shown here). Observers are asked to track the guide with attention, recreating the apparent motion shown in (b) but now with verifiably insufficient information for identification at each location. Despite having only incomplete information at each location, the moving attention window in Experiment 1 clearly reveals the target, demonstrating accumulation of object-specific information across locations.
Figure 2
Figure 2
(a, b) Stationary attention baseline. Observer attends to a single location while fixating the central dot. Arrays a and b alternate and the rate is varied to determine the rate at which it is no longer possible to report which color is paired with which direction of dot motion (about 2 or 3 Hz). Click on the links here to see demonstration movies at 2-Hz alternation rate where the pairing of colors and motions is easy to report, or at 3 Hz, or 4 Hz, where this becomes more difficult (actual display rate may deviate from intended rate). This stationary attention condition evaluates the time requirements of local analyses. (c, d) Moving attention condition. Identical stimulus except there is now a ring that the observer follows with attention as it moves one position per alternation, continuing around the display, potentially enabling the accumulation of local computations. It always arrives at a location when the same value (inward moving red dots in the trial shown here) is present. The direction of dot motion and their color are now much easier to report, with the threshold rate for 75% accuracy more than twice as high as in the stationary attention condition. Click on the links here to see demonstration movies at alternation rates of 2 Hz, 3 Hz, or 4 Hz, where reporting the pairing of color and motion within the moving guide should be easier than for the stationary case.
Figure 3
Figure 3
Accuracy of color–motion report. Left panel: Accuracy for guide and no-guide sessions is shown for one observer, PC, as a function of alternation rate (plotted on a log scale). Dashed horizontal line is the chance level. Solid horizontal line is the 75% threshold criterion. Right panel: Threshold rates are shown (on log scale) for 5 observers with white bars for the thresholds with moving attention and black bars for the thresholds with stationary attention (no guide). Vertical lines above the bars show +1 SE. Threshold rate for reporting correct pairing of color and motion is 3.6 to 6.2 Hz when following the moving target (white bars). Threshold is only 1.8 to 2.5 Hz when attending to a stationary location (black bars).
Figure 4
Figure 4
Single ring control. Arrays a and b alternate as in Experiment 1 but now a white ring cues the target pairing (red-in here) at a fixed location every time it occurs there. The observer fixates the central dot and attends to the bottom location to report the color and motion pairing within the ring. Click on the link here to see a demonstration movie at an alternation rate of 4 Hz where reporting the pairing of color and motion within the guide may be difficult.
Figure 5
Figure 5
Multiple ring control. Arrays a and b alternate and all target pairings (red-in here) are encircled on each frame. The observer fixates the central dot and can attend anywhere but must avoid tracking any motion of the rings. Click on the link here to see a demonstration movie at 4 Hz where reporting the pairing of color and motion within any of the guides may be difficult.
Figure 6
Figure 6
Control experiments. Accuracy data from 3 observers at 3-Hz rate for MV and SA and 4 Hz for PC. The dashed line at 50% represents chance performance. The No Guide and the Moving Guide conditions duplicate the stationary and moving attention conditions of Experiment 1 but at the fixed rate (3 or 4 Hz). The 1 Stationary Guide condition had a ring at the bottom location on alternate frames, always encircling the same paring (Figure 4). The Longer Duration condition was the same as the 1 Stationary Guide but with twice the number of test arrays. The 5 Stationary Guides had a ring around all target pairings on each array (Figure 5). In the Random Guide condition, the guide moved to random positions on each array and observers attempted to attend to it. Click on the link here to see a demonstration movie at 4 Hz where reporting the pairing of color and motion within the randomly moving guide may be difficult.
Figure 7
Figure 7
Single-sample control. Solid bars show the thresholds for a single target encircled by a guide ring with attention held at the target location. When attention follows a moving guide and passes through the same single target, threshold rates are higher (striped bars). For comparison, thresholds of these observers from Experiment 1 are shown for moving attention (sampling 6 target locations) with outline bars. Vertical lines above the bars show +1 SE.
Figure 8
Figure 8
Accumulation control conditions. Moving: One through 5 patches of alternating color and motion were presented and, while fixating the central dot, observers tracked the moving ring. The outline symbols in the right-hand panel shows the percent correct report of the color and motion pairing present in the ring—the ring steps in synchrony with the alternation so the same pairing is present in the ring at each filled location. Performance is near chance for all 3 observers when the ring’s trajectory samples only 1 or 2 locations but rises to very high accuracy once 3 or 4 locations are sampled. Stationary: One or 5 target patches are presented at a single location, alternating with the complementary pair. The guide ring encircles only the target pair and always at the same location. Performance does not improve (filled symbols) with additional samples. Click on the links here to see demonstration movies of the guide ring stepping around the display and sampling one, three or five locations at a 4-Hz alternation rate where reporting the pairing of color and motion within the moving ring should become easier as the number of locations increases.
Figure 9
Figure 9
Accuracy of individual color and motion reports. (a) Accuracy for stationary ring and moving ring conditions is shown for color stimuli for one observer, WL, as a function of alternation rate (plotted on a log scale). Dashed horizontal line is the chance level. Solid horizontal line is the 75% threshold criterion. (b) Threshold rates for color stimuli are shown (on log scale) for 3 observers with white bars for the thresholds with moving ring and black bars for the thresholds with stationary rings. Vertical lines above the bars show +1 SE. (c) Accuracy for motion stimuli, observer WL. (d) Threshold rates for motion stimuli.
Figure 10
Figure 10
Accumulation for individual features. The percent correct report of the color (outline symbols) or motion (filled symbols) is shown as a function of the number of locations sampled for 3 observers (WL, circles; SD, squares; CH, diamonds). Accumulation is seen in all cases but more so for color.
Figure 11
Figure 11
Letter/digit masking. Arrays a and b. In the stationary attention condition, the mask and letter or digit target alternate at each location, but no guide ring is present. The observer attends to one location while fixating the central dot and reports whether the letter or digit is a normal or left–right reversed version (reversed here). In the moving attention condition, the observer also fixates the center but now tracks the guide ring with attention as it continues around the display (only two positions shown here). In each array it encircles the target and never the mask. The observer again reports whether the target is normally oriented or left–right reversed. Click on the links here to see demonstration movies of the stationary attention display at a 2.5-Hz or 5-Hz alternation rate, or the moving attention condition at a 2.5-Hz or 5-Hz alternation rate. Reporting the target orientation should be easier at 2.5 Hz with or without the guide, and difficult at 5 Hz, with or without the guide.
Figure 12
Figure 12
Threshold rate for reporting target orientation (mirror versus normal). Left panel: Accuracy data for one observer as a function of alternation rates shown on log scale. Guide data, open symbols and Guide fit, dashed line; No Guide data, black circles and No Guide fit, solid line. Dashed horizontal line shows chance level; solid horizontal line shows 75% threshold level. Right panel: 75% threshold rates on log scale for 4 observers. White bars for Guide conditions and black bars for No Guide. Thin vertical lines show +1 SE.
Figure 13
Figure 13
Attention sampling from a fixed location. A channel opens for transfer of information from location 1, but it has a minimum duration or dwell time before it can close again, typically no less than 200 ms (Duncan et al., 1994; Theeuwes, Godin, & Pratt, 2004). During that time, the alternating stimulus cycles between the two values and the resulting interruptions degrade the ability to identify and combine the colors and motions appropriately.
Figure 14
Figure 14
(a) Attention sampling from a moving location. (b) When attention is moving, it might open a channel at each location that must remain open for the minimum dwell time before closing again. With this retinotopic dwell time, alternating stimuli at each location would be integrated to the same extent with moving or stationary attention. (c) However, our data demonstrate that moving attention can offer substantial performance advantages, suggesting that the channel, once open, does not stay open in retinotopic coordinates, but stays open along the trajectory of motion. It may remain open only for a split second at each location (local dwell time as little as 50 ms in Experiment 3), allowing attention to sample very brief instants from a rapidly changing stream whose elements would be otherwise inaccessible to attention. Our data from accumulation experiments suggest that the total dwell time (the time during which an attention-dependent process is susceptible to interruption from a subsequent stimulus) is still long, about 300 ms, but the stimuli that can interrupt are only those falling on the attention trajectory.

References

    1. Abbott LF. Where are the switches on this thing? In: van Hemmen JL, Sejnowski TJ, editors. 23 problems in systems neuroscience. Oxford: Oxford University Press; 2001.
    1. Afraz SR, Cavanagh P. Retinotopy of the face aftereffect. Vision Research. 2008;48:42–54. - PMC - PubMed
    1. Arnold DH. Perceptual pairing of colour and motion. Vision Research. 2005;45:3015–3026. - PubMed
    1. Avidan G, Hasson U, Malach R, Behrmann M. Detailed exploration of face-related processing in congenital prosopagnosia: 2. Functional neuroimaging findings. Journal of Cognitive Neuroscience. 2005;17:1150–1167. - PubMed
    1. Bahill AT, McDonald JD. Smooth pursuit eye movements in response to predictable target motions. Vision Research. 1983;23:1573–1583. - PubMed

Publication types