. 2008 Jul 18;8(9):8.1-19.
doi: 10.1167/8.9.8.

Figure-ground interaction in the human visual cortex

Affiliations

Figure-ground interaction in the human visual cortex

Lawrence G Appelbaum et al. J Vis. .

Abstract

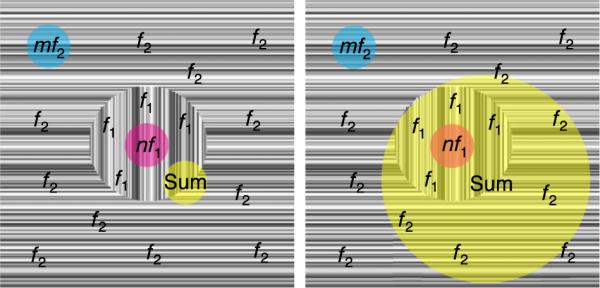
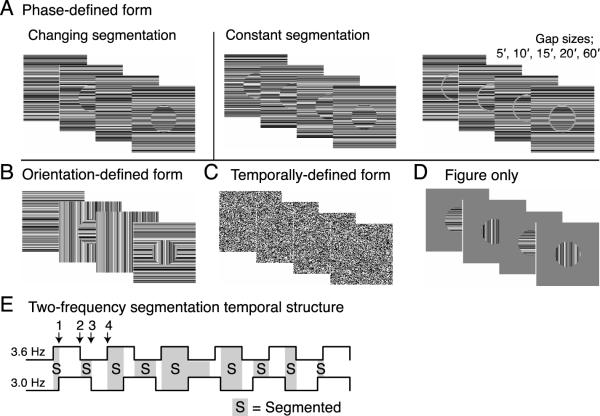
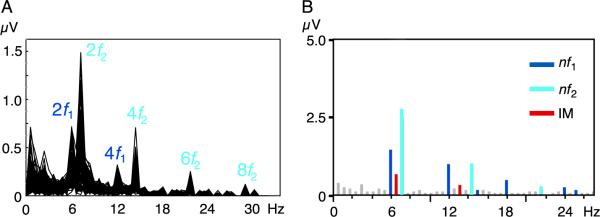
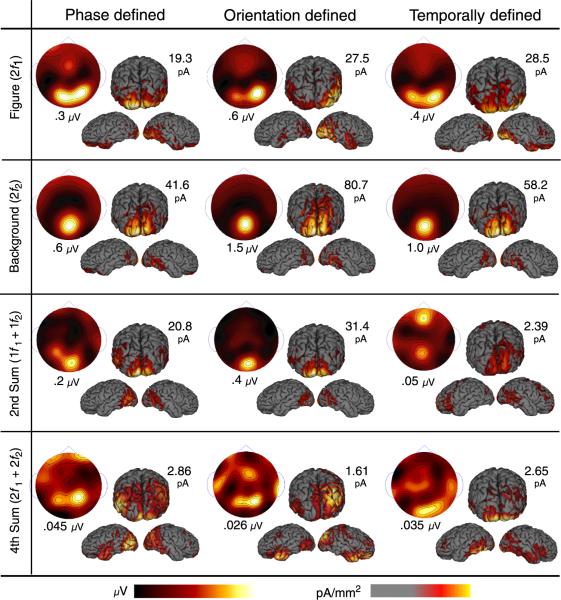
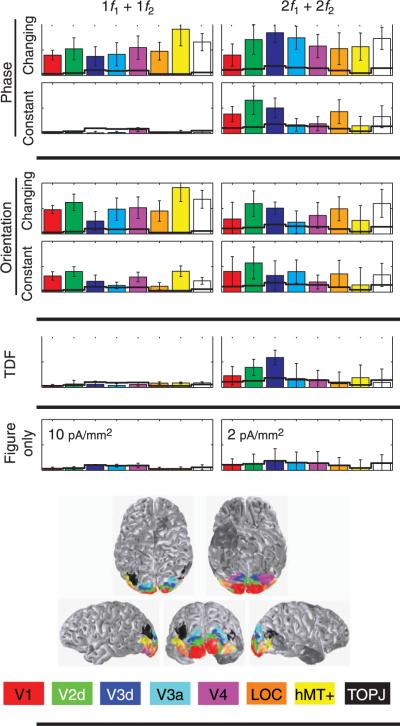
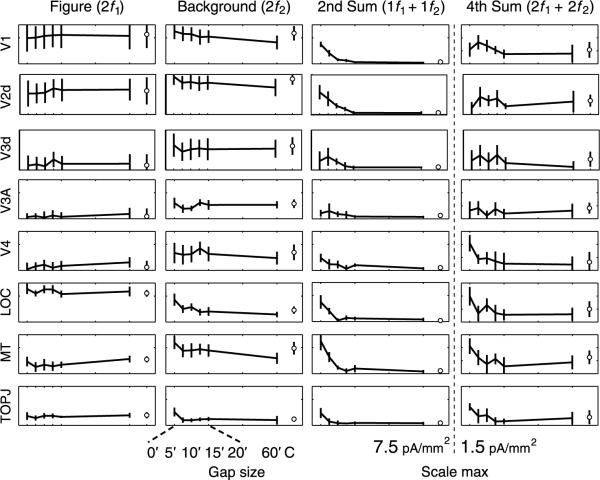
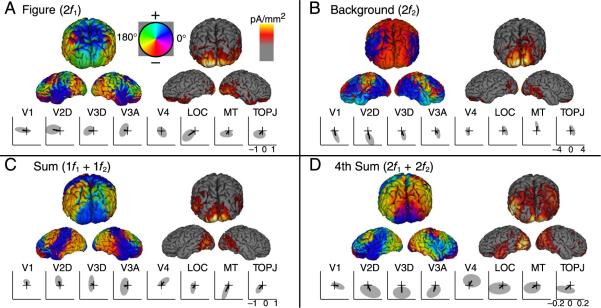
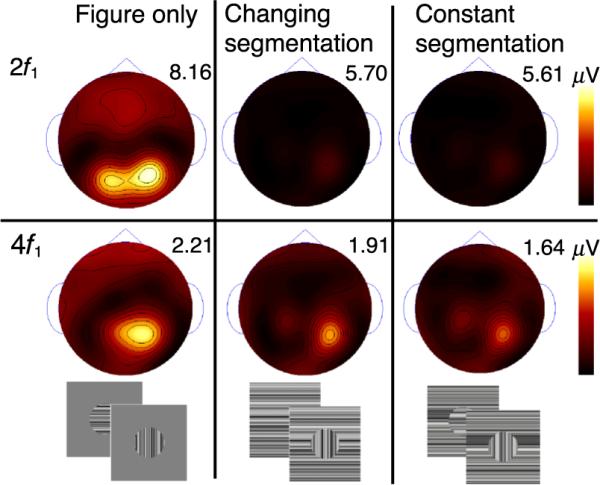
Discontinuities in feature maps serve as important cues for the location of object boundaries. Here we used multi-input nonlinear analysis methods and EEG source imaging to assess the role of several different boundary cues in visual scene segmentation. Synthetic figure/ground displays portraying a circular figure region were defined solely by differences in the temporal frequency of the figure and background regions in the limiting case and by the addition of orientation or relative alignment cues in other cases. The use of distinct temporal frequencies made it possible to separately record responses arising from each region and to characterize the nature of nonlinear interactions between the two regions as measured in a set of retinotopically and functionally defined cortical areas. Figure/background interactions were prominent in retinotopic areas, and in an extra-striate region lying dorsal and anterior to area MT+. Figure/background interaction was greatly diminished by the elimination of orientation cues, the introduction of small gaps between the two regions, or by the presence of a constant second-order border between regions. Nonlinear figure/background interactions therefore carry spatially precise, time-locked information about the continuity/discontinuity of oriented texture fields. This information is widely distributed throughout occipital areas, including areas that do not display strong retinotopy.


Figures

Figure 1
Figure 1
Schematic illustration of hypothetical populations of neurons responding to a texture segmentation display. The figure region is driven at a frequency equal to f1 and the background is driven at a frequency equal to f2. Neurons with receptive fields that are restricted to the figure region (magenta) generate responses at harmonics of f1 (nf1). Neurons with receptive fields that are restricted to the background region (cyan) generate responses at harmonics of f2 (mf2). Neurons whose receptive fields span both regions (yellow) may generate responses at both nf1 and mf2, as well as frequencies equal to nf1 ± mf2, where n and m are small integers (e.g., the sum 1f1 + 1f2).
Figure 2
Figure 2
Stimulus schematics illustrating four stimulus frames for each of four cue types; (A) phase-defined, (B) orientation-defined, (C) temporally-defined, and (D) luminance/texture defined. Comparison stimuli in which the segmentation state is constant are shown on the right for the phase-defined stimulus. The temporal structure and resulting segmentation states of the two-frequency stimuli is illustrated below E).
Figure 3
Figure 3
EEG spectra derived from the phase-defined form are shown for (A) the 13 observer average with all 128 sensors superimposed and (B) for a single sensor from one observer. Figure responses are indicted in blue, background responses in cyan, and nonlinear interactions in red.
Figure 4
Figure 4
Average voltage and current distributions are shown at the second harmonic of each tag frequency (rows 1 and 2) and at their 2nd and 4th order sums (rows 3 and 4). For each response, average spline interpolated topographic maps (μV) and cortical surface current density distributions (three views, thresholded at 1/3 the max in pA/mm2) are shown with their corresponding maximum scale values (see colorbars below). Second harmonic responses for the figure (row 1) and background (row 2) show distinct distributions that are similar across cue types. Second-order sum-term interaction is large (row 3) for phase- and orientation-defined forms but not for temporally defined forms (note scale values). The magnitude and distribution of the fourth-order interaction (row 4) also differs somewhat across cue type.
Figure 5
Figure 5
ROI response histograms are shown for the second-(left) and fourth-order (right) sum terms. Average projected magnitudes and standard errors are plotted for each ROI. Separate ROIs are color-coded as indicated in the legend at the bottom. The locations of these ROIs are shown for a single observer from 5 perspectives. Noise estimates are derived from the figure only condition (bottom row) and shown as black lines overlaid on the ROI response profile for all other conditions. Scales are indicated in the bottom plot.
Figure 6
Figure 6
Gap Functions are shown for each ROI at the second harmonic of each tag, and at their second- and fourth-order sums. In each panel, ROI projected amplitude is plotted as a function of gap size. Data points for the constant segmentation stimuli are indicated with the open symbols to the right of each plot (C). Error bars reflect the SEM across observers.
Figure 7
Figure 7
Spectral phase distributions: Cortical phase maps and 2-D complex-valued ROI responses are shown at four frequencies for the phase-defined form stimulus. Unthresholded grand average phase maps are shown from posterior and lateral perspectives (left) next to the mean thresholded (1/3 max) amplitude maps from Figure 4 (right). Average ROI responses for V1, V2d, V3d, V3A, V4, LOC, MT+, and TOPJ are shown below their corresponding maps. Ellipses indicate 95% confidence limits and the phase convention places 0- delay at 3o'clock, as indicated by the color wheel.
Figure 8
Figure 8
Figure region response distribution at the second (top) and fourth harmonic (bottom) under three background contexts. Response maxima are indicated above each map, and maps for each row are on the same scale. Two stimulus frames for each condition are presented below.

References

    1. Allman J, Miezin F, McGuinness E. Direction- and velocity-specific responses from beyond the classical receptive field in the middle temporal visual area (MT) Perception. 1985;14:105–126. - PubMed
    1. Angelucci A, Bressloff PC. Contribution of feedforward, lateral and feedback connections to the classical receptive field center and extra-classical receptive field surround of primate V1 neurons. Progress in Brain Research. 2006;154:93–120. - PubMed
    1. Appelbaum LG, Wade AR, Vildavski VY, Pettet MW, Norcia AM. Cue-invariant networks for figure and background processing in human visual cortex. Journal of Neuroscience. 2006;26:11695–11708. - PMC - PubMed
    1. Bach M, Meigen T. Electrophysiological correlates of texture segregation in the human visual evoked potential. Vision Research. 1992;32:417–424. - PubMed
    1. Baitch LW, Levi DM. Evidence for nonlinear binocular interactions in human visual cortex. Vision Research. 1988;28:1139–1143. - PubMed

Publication types