

Assessment of data processing to improve reliability of microarray experiments using genomic DNA reference
- PMID: 18831796
- PMCID: PMC2559895
- DOI: 10.1186/1471-2164-9-S2-S5
Assessment of data processing to improve reliability of microarray experiments using genomic DNA reference
Abstract
Background: Using genomic DNA as common reference in microarray experiments has recently been tested by different laboratories. Conflicting results have been reported with regard to the reliability of microarray results using this method. To explain it, we hypothesize that data processing is a critical element that impacts the data quality.
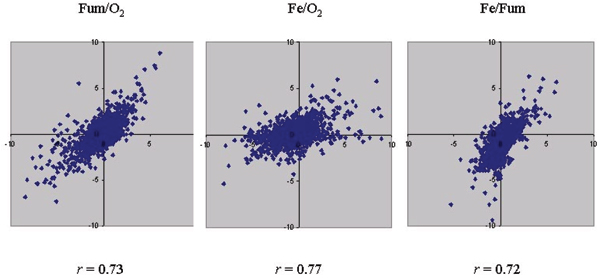
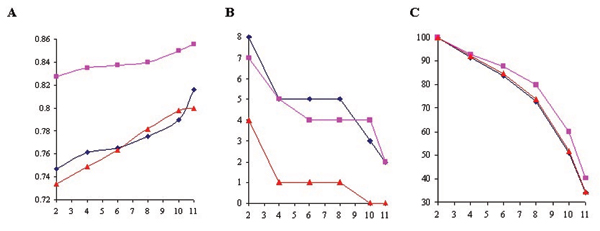
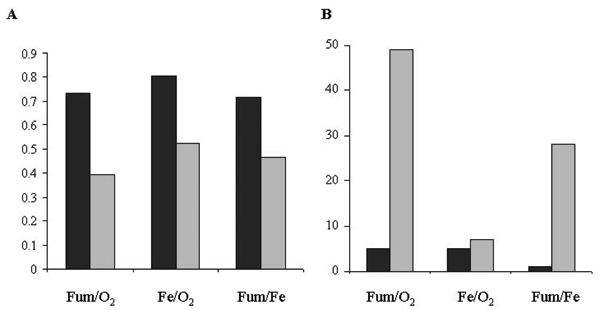
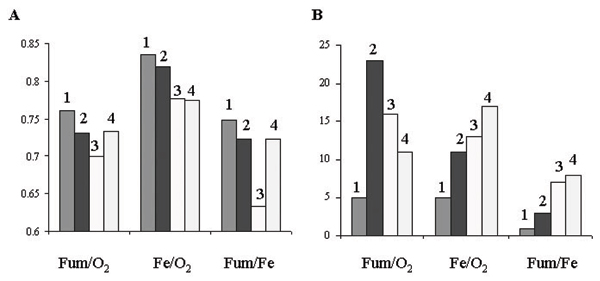
Results: Microarray experiments were performed in a gamma-proteobacterium Shewanella oneidensis. Pair-wise comparison of three experimental conditions was obtained either with two labeled cDNA samples co-hybridized to the same array, or by employing Shewanella genomic DNA as a standard reference. Various data processing techniques were exploited to reduce the amount of inconsistency between both methods and the results were assessed. We discovered that data quality was significantly improved by imposing the constraint of minimal number of replicates, logarithmic transformation and random error analyses.
Conclusion: These findings demonstrate that data processing significantly influences data quality, which provides an explanation for the conflicting evaluation in the literature. This work could serve as a guideline for microarray data analysis using genomic DNA as a standard reference.
Figures
Similar articles
-
An analysis of the use of genomic DNA as a universal reference in two channel DNA microarrays.BMC Genomics. 2005 May 8;6:66. doi: 10.1186/1471-2164-6-66. BMC Genomics. 2005. PMID: 15877823 Free PMC article.
-
A generally applicable validation scheme for the assessment of factors involved in reproducibility and quality of DNA-microarray data.BMC Genomics. 2005 May 20;6:77. doi: 10.1186/1471-2164-6-77. BMC Genomics. 2005. PMID: 15907200 Free PMC article.
-
Development of a common oligonucleotide reference standard for microarray data normalization and comparison across different microbial communities.Appl Environ Microbiol. 2010 Feb;76(4):1088-94. doi: 10.1128/AEM.02749-09. Epub 2009 Dec 28. Appl Environ Microbiol. 2010. PMID: 20038701 Free PMC article.
-
Computational approaches to analysis of DNA microarray data.Yearb Med Inform. 2006:91-103. Yearb Med Inform. 2006. PMID: 17051302 Review.
-
Genomic profiling: cDNA arrays and oligoarrays.Methods Mol Biol. 2012;823:89-105. doi: 10.1007/978-1-60327-216-2_7. Methods Mol Biol. 2012. PMID: 22081341 Review.
Cited by
-
Snapshot of iron response in Shewanella oneidensis by gene network reconstruction.BMC Genomics. 2009 Mar 25;10:131. doi: 10.1186/1471-2164-10-131. BMC Genomics. 2009. PMID: 19321007 Free PMC article.
-
Genome-scale resources for Thermoanaerobacterium saccharolyticum.BMC Syst Biol. 2015 Jun 26;9:30. doi: 10.1186/s12918-015-0159-x. BMC Syst Biol. 2015. PMID: 26111937 Free PMC article.
-
The tricarboxylic acid cycle in Shewanella oneidensis is independent of Fur and RyhB control.BMC Microbiol. 2010 Oct 16;10:264. doi: 10.1186/1471-2180-10-264. BMC Microbiol. 2010. PMID: 20950482 Free PMC article.
-
Genomics, molecular imaging, bioinformatics, and bio-nano-info integration are synergistic components of translational medicine and personalized healthcare research.BMC Genomics. 2008 Sep 16;9 Suppl 2(Suppl 2):I1. doi: 10.1186/1471-2164-9-S2-I1. BMC Genomics. 2008. PMID: 18831773 Free PMC article.
References
-
- Schena M, Shalon D, Davis RW, Brown PO. Quantitative monitoring of gene expression patterns with a complementary DNA microarray. Science. 1995;270:467–470. - PubMed
-
- Shoemaker DD, Linsley PS. Recent developments in DNA microarrays. Curr Opin Microbiol. 2002;5:334–337. - PubMed
-
- Hegde P, Qi R, Abernathy K, Gay C, Dharap S, Gaspard R, Hughes JE, Snesrud E, Lee N, Quackenbush J. A concise guide to cDNA microarray analysis. Biotechniques. 2000;29:548–550. 552-544, 556 passim. - PubMed
Publication types
MeSH terms
Substances
LinkOut - more resources
Full Text Sources
