. 2008 Oct 1;22(19):2692-706.
doi: 10.1101/gad.486108.

Role of Cdx2 and cell polarity in cell allocation and specification of trophectoderm and inner cell mass in the mouse embryo

Affiliations

Role of Cdx2 and cell polarity in cell allocation and specification of trophectoderm and inner cell mass in the mouse embryo

Agnieszka Jedrusik et al. Genes Dev. .

Abstract

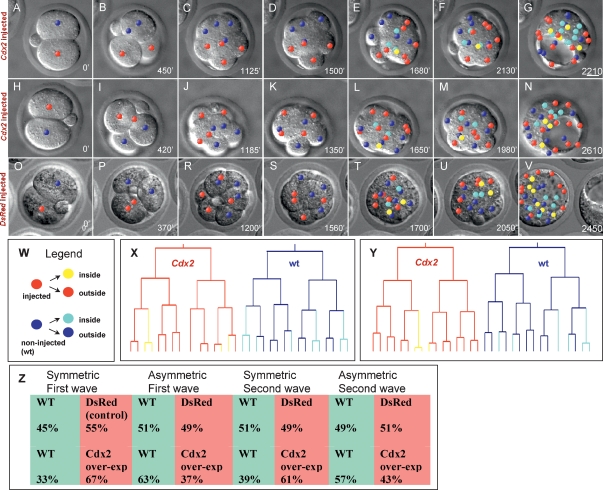
Genesis of the trophectoderm and inner cell mass (ICM) lineages occurs in two stages. It is initiated via asymmetric divisions of eight- and 16-cell blastomeres that allocate cells to inner and outer positions, each with different developmental fates. Outside cells become committed to the trophectoderm at the blastocyst stage through Cdx2 activity, but here we show that Cdx2 can also act earlier to influence cell allocation. Increasing Cdx2 levels in individual blastomeres promotes symmetric divisions, thereby allocating more cells to the trophectoderm, whereas reducing Cdx2 promotes asymmetric divisions and consequently contribution to the ICM. Furthermore, both Cdx2 mRNA and protein levels are heterogeneous at the eight-cell stage. This heterogeneity depends on cell origin and has developmental consequences. Cdx2 expression is minimal in cells with unrestricted developmental potential that contribute preferentially to the ICM and is maximal in cells with reduced potential that contribute more to the trophectoderm. Finally, we describe a mutually reinforcing relationship between cellular polarity and Cdx2: Cdx2 influences cell polarity by up-regulating aPKC, but cell polarity also influences Cdx2 through asymmetric distribution of Cdx2 mRNA in polarized blastomeres. Thus, divisions generating inside and outside cells are truly asymmetric with respect to cell fate instructions. These two interacting effects ensure the generation of a stable outer epithelium by the blastocyst stage.


Figures

Figure 1.
Figure 1.
Elevation of Cdx2 leads to a greater proportion of cells developing into the trophectoderm. One blastomere of a late two-cell/early four-cell embryo was injected with mRNA for both DsRed and Cdx2, or, in the control, only DsRed mRNA. (A,B) Sections through embryos at the four- to eight-cell transition. (A) In controls, clones from blastomeres injected with DsRed mRNA alone do not show up-regulation of Cdx2 protein. (B) Cdx2 mRNA-injected blastomeres show early expression of nuclear Cdx2 protein (green plus red = yellow). Bar, 10 μm. (C,D). The distribution of the progeny from the injected and noninjected blastomeres was analyzed at the blastocyst stage. In the Cdx2-injected group (red, D) significantly more progeny contributed to the trophectoderm than in the control group (C). Each panel shows nine individual confocal sections of a blastocyst. (E) Proportion of trophectoderm (TE) and ICM derived from injected (I) and noninjected (wt) clones in the experimental (Cdx2 + DsRed) and control (DsRed control) groups.
Figure 2.
Figure 2.
Elevation of Cdx2 expression promotes symmetric divisions. Cdx2 was overexpressed in one late two-cell/early four-cell blastomere, and embryos were followed by time-lapse microscopy to the blastocyst stage (two sample embryos shown in AG and HN). In controls, DsRed mRNA only was injected (OV). Lineages were generated with SIMI Biocell software, and the centers of the nuclei from each clone are marked either red (injected clone) or blue (wild-type clone). From 16-cell onward, nuclei of inside cells are marked yellow (injected clone) or light blue (wild-type clone); see W for coding. Cdx2 expression leads to significantly more symmetric than asymmetric divisions (indicated by the relative numbers of yellow versus light blue cells). Merged 3D representations and DIC images from three different embryos are shown in AG, HN, and OV. Times of images are in minutes. Schematic representation of lineage trees was generated with SIMI Biocell software (X; embryo AG, Y; embryo HN). (Z) Proportions of symmetric or asymmetric divisions taken by clones expressing injected Cdx2 mRNA or DsRed mRNA relative to the clone derived from the noninjected cell (see also Supplemental Table 2).
Figure 3.
Figure 3.
Down-regulation of Cdx2 expression leads to a reduced contribution to the trophectoderm. Cdx2 was down-regulated in half of the embryo by dsRNA injection to one blastomere. (AH) Sections through fixed and immunocytochemically stained embryos at the morula (AD) and blastocyst (EH) stage show specific knockdown of Cdx2 protein in the injected clone; the white dashed line indicates injected cell progeny. (I) Schematic of lineage trees generated with SIMI Biocell software. (JO) Embryos were followed by time-lapse microscopy to the blastocyst stage. Merged 3D representations and DIC images are shown; times of images are in minutes. Color-coding as in Figure 2. (P) Proportions of symmetric/asymmetric divisions taken by the Cdx2 RNAi-injected clone relative to the wild-type clone at fourth and fifth cleavage rounds (see also Supplemental Table 3A).
Figure 4.
Figure 4.
Cdx2 influences the extent of aPKC localization. Cdx2 was overexpressed in half of the embryos at the late two-cell stage (DsRed mRNA was coinjected as a lineage marker). Embryos were fixed at the four- to eight-cell transition, immunostained for aPKC (green), and the nuclei stained with DAPI (blue). Examples of two embryos (one shown in AD and the other shown in EL): The first three sets of panels in each row are sections and the last a merged image. White arrows indicate regions of intense aPKC staining within enlarged apical domains in the clone overexpressing Cdx2. White arrowheads show aPKC concentrates in the cytoplasm of injected blastomeres. Bar, 10 μm.
Figure 5.
Figure 5.
Expression patterns of Cdx2 protein during development. One two-cell blastomere was injected with rhodamine dextran, and embryos were monitored through division to four cells and sorted into groups according to the sequence of second cleavage division orientations (ME or EM), and which of the dividing cells was positive for dextran. Embryos were then cultured until 7 h after the onset of the eight-cell stage and stained as in A and B. (A) Cytoplasmic rhodamine signal in two of the four eight-cells visible indicates dextran status, which in this example were derived from an M-dividing cell. (B) Cdx2 expression in the same section, with arrowheads indicating strong nuclear expression in progeny of the E dividing blastomere, and arrows indicating weak expression in their M-derived counterparts. (C) Phase image of the same embryo. (D) DNA stained with TOTO3 in the same plane through the same embryo. (E) Blastomeres in nine ME and 10 EM embryos (making 72 and 80 blastomeres, respectively) were scored for Cdx2 expression status as negative, weak, or strong by two independent scorers who were blind to the origin of embryos and each other’s score. The cumulative score for all cells is shown. The only cross-comparison showing a significant difference was between M- and E-derived strongly staining blastomeres from ME embryos (P = 0.004; fourfold χ2 test, df = 1). Bar, 10 μm.
Figure 6.
Figure 6.
Differential Cdx2 mRNA expression at the eight-cell stage in blastomeres derived from ME and EM embryos. (A) Tracking of blastomere divisions and the harvesting of 2/8 blastomere pairs. One two-cell blastomere was injected with rhodamine dextran. In vitro cultured embryos were observed every 15–20 min and subsequently sorted based on the division plane orientation of the first dividing blastomere, with respect to the AV axis (either M or E) as indicated by the position of the polar body. The second division was similarly classified, thus identifying ME and EM embryos (the few MM and EE embryos were not analyzed). At the four-cell stage, the blastomere in the vegetal (V) position was injected with FITC-conjugated dextran (green). Embryos were cultured until the eight-cell stage had occurred, disaggregated into 4× 2/8 pairs per embryo, the pairs were sorted according to type as shown, and total RNA was extracted from each 2/8 pair for gene expression analysis. (B) Taqman real-time PCR analysis of 68 individual 2/8 blastomere pairs (as defined in A) from 10 ME and seven EM eight-cell embryos. The expression, in technical triplicate, of Oct4, Cdx2, Sall4, and Esrrb was determined in each 2/8 blastomere pair. The data are presented as a ratio against the Oct4 values. Note that the Cdx2:Oct4 ratio is both higher and more variable in ME than EM embryos. (C) The averaged ratios (+SD) of all the AV 2/8 blastomeres compared with those for the all combined A plus V samples shown separately for the ME and EM embryos. Note that for ME-derived 2/8 blastomere pairs, relative Cdx2 levels are significantly higher in combined A plus V blastomeres than in AV blastomeres (when distributions are compared in a Mann-Whitney test; P < 0.001) and that relative Sall4 levels are lower for the ME-derived 2/8 pairs than for the EM-derived 2/8 pairs regardless of type (P < 0.001; Student’s t-test). (D) Tabulated data from B and C showing mean, median, SD, minimum, maximum, and upper (Q1) and lower (Q3) quartile values for pooled expression data of AV1 plus AV2, and for pooled A plus V blastomeres in ME and EM embryos. P-values are shown for a Mann-Whitney test, between the datasets from M and E blastomeres within ME and EM embryos.
Figure 7.
Figure 7.
Apical localization of Cdx2 mRNA in eight- and 16-outer-cell blastomeres. Fluorescent whole-mount in situ hybridization for mRNA. Each section is taken in a central plane through the embryo and visualized either for RNA or for nucleus stained by DAPI (′). (AD) Apical localization of Cdx2 mRNA in eight- to 16-cell embryos using the antisense probe. (C) Note retention of apical localization in mitotic cell. (E) Control using sense probe. (F) Four-cell stage with no clear signal. (G) Cdx2 mRNA in consecutive sections through one eight-cell embryo to show apical location. (H) Cdx2 mRNA in embryos in which dsRNA for Cdx2 had been injected into one late two-cell-stage blastomere. (Red and blue arrows) Progeny of injected blastomeres that lack signal. Bar, 10 μm.

References

    1. Avilion A.A., Nicolis S.K., Pevny L.H., Perez L., Vivian N., Lovell-Badge R. Multipotent cell lineages in early mouse development depend on SOX2 function. Genes & Dev. 2003;17:126–140. - PMC - PubMed
    1. Bischoff M., Parfitt D.E., Zernicka-Goetz M. Formation of the embryonic–abembryonic axis of the mouse blastocyst: Relationships between orientation of early cleavage divisions and pattern of symmetric/asymmetric divisions. Development. 2008;135:953–962. - PMC - PubMed
    1. Chazaud C., Yamanaka Y., Pawson T., Rossant J. Early lineage segregation between epiblast and primitive endoderm in mouse blastocysts through the Grb2–MAPK pathway. Dev. Cell. 2006;10:615–624. - PubMed
    1. Ciruna B., Rossant J. FGF signalling regulates mesoderm cell fate specification and morphogenetic movement at the primitive steak. Dev. Cell. 2001;1:37–49. - PubMed
    1. Dietrich J.E., Hiiragi T. Stochastic patterning in the mouse pre-implantation embryo. Development. 2007;134:4219–4231. - PubMed

Publication types

MeSH terms

LinkOut - more resources