. 2008 Dec;295(6):R1782-93.
doi: 10.1152/ajpregu.90635.2008. Epub 2008 Oct 1.

Development and characterization of a novel rat model of type 2 diabetes mellitus: the UC Davis type 2 diabetes mellitus UCD-T2DM rat

Affiliations

Development and characterization of a novel rat model of type 2 diabetes mellitus: the UC Davis type 2 diabetes mellitus UCD-T2DM rat

Bethany P Cummings et al. Am J Physiol Regul Integr Comp Physiol. 2008 Dec.

Abstract

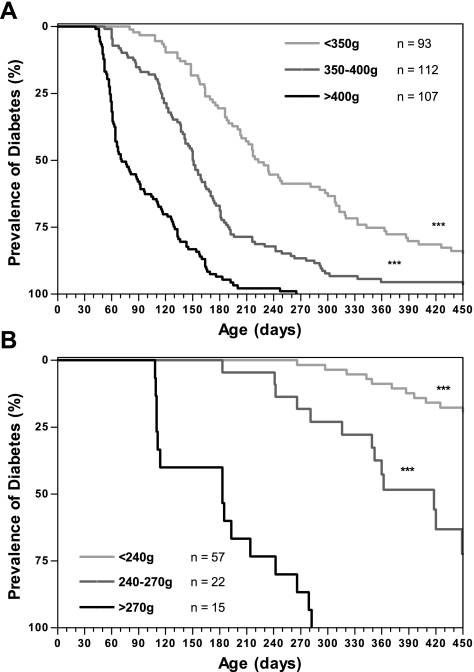
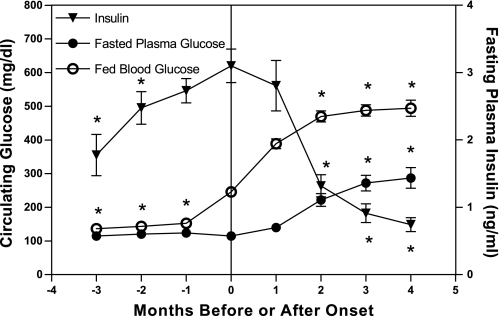
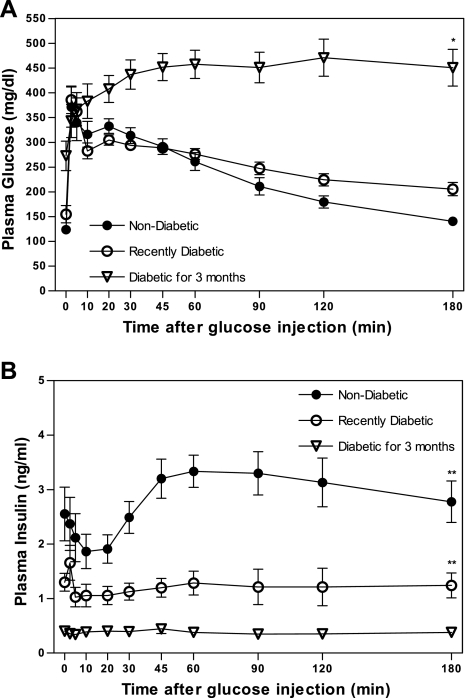
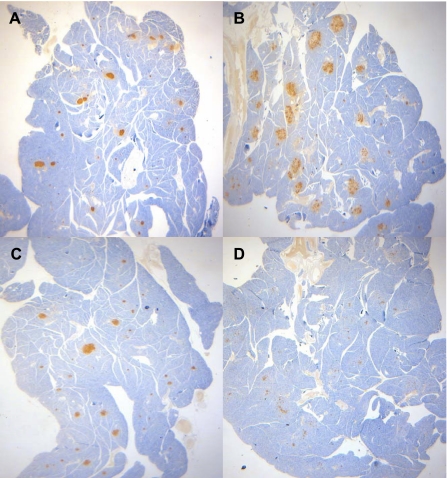
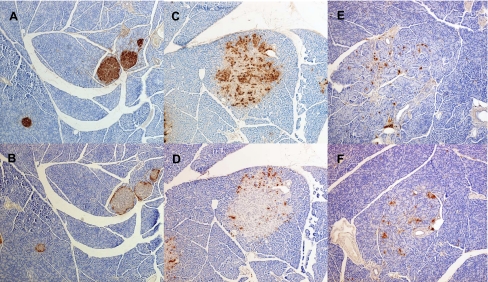
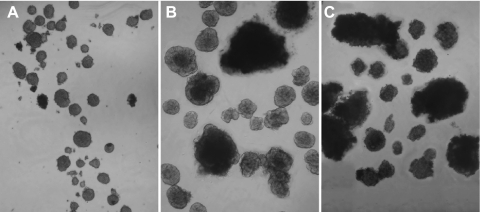
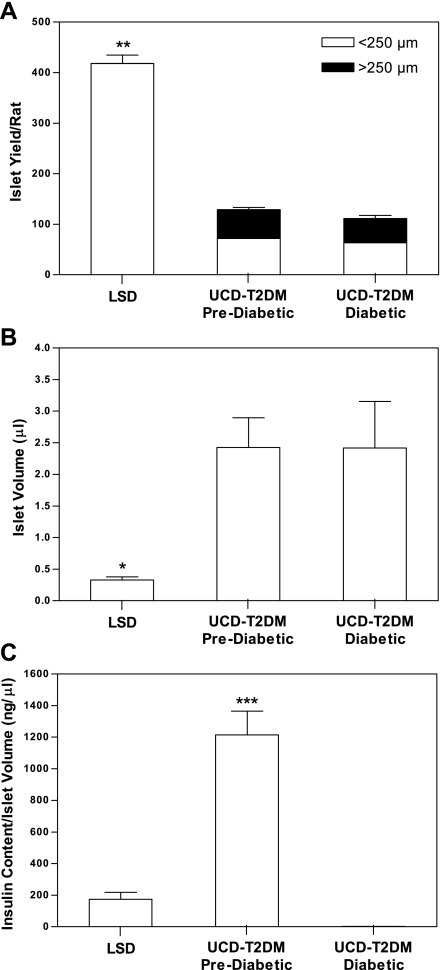
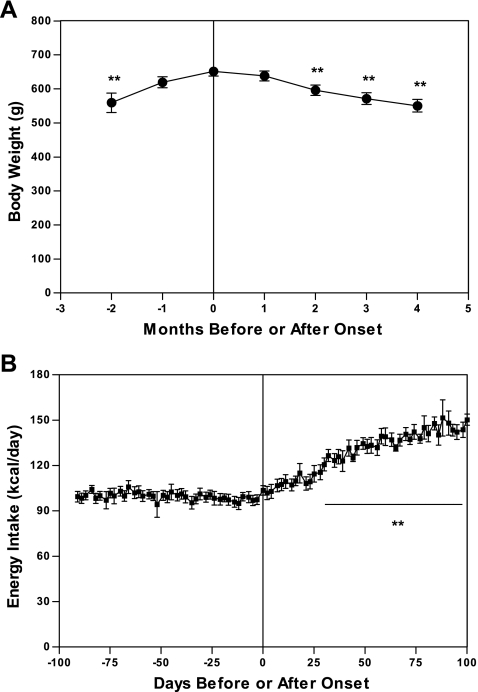
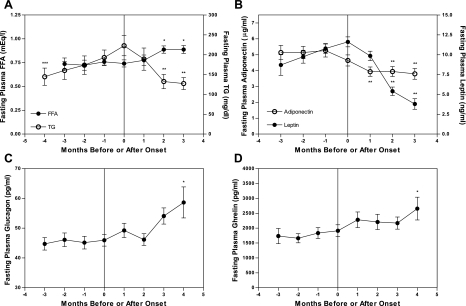
The prevalence of type 2 diabetes (T2DM) is increasing, creating a need for T2DM animal models for the study of disease pathogenesis, prevention, and treatment. The purpose of this project was to develop a rat model of T2DM that more closely models the pathophysiology of T2DM in humans. The model was created by crossing obese Sprague-Dawley rats with insulin resistance resulting from polygenic adult-onset obesity with Zucker diabetic fatty-lean rats that have a defect in pancreatic beta-cell function but normal leptin signaling. We have characterized the model with respect to diabetes incidence; age of onset; longitudinal measurements of glucose, insulin, and lipids; and glucose tolerance. Longitudinal fasting glucose and insulin data demonstrated progressive hyperglycemia (with fasting and fed glucose concentrations >250 and >450 mg/dl, respectively) after onset along with hyperinsulinemia resulting from insulin resistance at onset followed by a progressive decline in circulating insulin concentrations, indicative of beta-cell decompensation. The incidence of diabetes in male and female rats was 92 and 43%, respectively, with an average age of onset of 6 mo in males and 9.5 mo in females. Results from intravenous glucose tolerance tests, pancreas immunohistochemistry, and islet insulin content further support a role for beta-cell dysfunction in the pathophysiology of T2DM in this model. Diabetic animals also exhibit glycosuria, polyuria, and hyperphagia. Thus diabetes in the UC Davis-T2DM rat is more similar to clinical T2DM in humans than in other existing rat models and provides a useful model for future studies of the pathophysiology, treatment, and prevention of T2DM.


Figures

Fig. 1.
Fig. 1.
Kaplan-Meier analysis of diabetes incidence in University of California, Davis, type 2 diabetes mellitus (UCD-T2DM) rats with animals categorized by body weight at 2 mo of age in male F7-F13 generations (A) and the female F7 generation (B). ***P < 0.0001 by log rank test compared with highest body weight class.
Fig. 2.
Fig. 2.
Longitudinal nonfasted blood glucose and fasting plasma glucose and insulin concentrations before and after diabetes onset. Values are means ± SE. One-way repeated measures ANOVA, *P <0.001 by Bonferroni's posttest compared with value at onset (n = 16, n = 14 4 mo after onset).
Fig. 3.
Fig. 3.
Plasma glucose (A) and plasma insulin (B) excursions in response to intravenous glucose administration (500 mg/kg body wt and 50% dextrose solution) in nondiabetic, 3-wk diabetic, and 3-mo diabetic UCD-T2DM rats after an overnight fast. Values are means ± SE. Two-way repeated measures ANOVA, *P <0.01 and **P <0.001 by Bonferroni's posttest compared with the nondiabetic group (n = 7 per group).
Fig. 4.
Fig. 4.
Representative ×20 magnification images of anti-insulin immunohistochemical analysis of formalin-fixed pancreas sections from male lean Sprague-Dawley control rat (LSD) at 4 mo of age (A), nondiabetic UCD-T2DM rat at 4 mo of age (B), 1-mo diabetic UCD-T2DM rat at 3 mo of age (C), and 3-mo diabetic UCD-T2DM rat at 6 mo of age (D).
Fig. 5.
Fig. 5.
Representative immunohistochemical analysis of pancreas sections from male LSD controls and UCD-T2DM rats at various stages of diabetes. All sections are at ×100 magnification. Anti-insulin immunohistochemistry staining for the following: A: LSD control at 4 mo of age; C: nondiabetic UCD-T2DM rat at 4 mo of age; and E: 3-mo diabetic UCD-T2DM rat at 6 mo of age. Anti-glucagon immunohistochemistry staining for the following: B: LSD control at 4 mo of age; D: nondiabetic UCD-T2DM rat at 4 mo of age; and F: 3-mo diabetic UCD-T2DM rat at 6 mo of age.
Fig. 6.
Fig. 6.
Islet size and shape comparison of islets isolated from LSD controls rats (A), prediabetic (B), and diabetic UCD-T2DM (C) rats. All animals are at 2.5 to 3 mo of age and 3.5 wk of diabetes in the diabetic group.
Fig. 7.
Fig. 7.
Yield and size distribution of isolated islets (A; LSD: n = 5, prediabetic: n = 5, and diabetic: n = 3), islet volume (B: LSD: n = 5, prediabetic: n = 5, and diabetic: n = 3), and insulin content per islet volume (C: LSD: n = 5, prediabetic: n = 5, and diabetic: n = 3) in islets isolated from prediabetic and diabetic UCD-T2DM rats and LSD control rats at 2.5 to 3 mo of age and 3.5 wk of diabetes in the diabetic group. Values are means ± SE. One-way ANOVA, *P < 0.05, **P <0.001 compared with prediabetic and diabetic UCD-T2DM rats and ***P < 0.001 compared with LSD and diabetic UCD-T2DM rats by Bonferroni's posttest.
Fig. 8.
Fig. 8.
Monthly body weight (A) and energy intake (B) before and after diabetes onset in UCD-T2DM rats. Values are means ± SE. One-way repeated measures ANOVA, **P <0.001 by Bonferroni's posttest compared with value at onset (n = 16).
Fig. 9.
Fig. 9.
A: longitudinal fasting plasma triglyceride (TG) and free fatty acids (FFA). TG: n = 12 at 4 mo before onset, n = 16 at all other time points; and FFA: n = 12 at 2 and 3 mo before onset, n = 16 at all other time points. B: longitudinal fasting plasma adiponectin and leptin. Adiponectin: n = 16 at all time points; and leptin: n = 13 at 3 mo before onset, n = 16 at all other time points. C: longitudinal fasting plasma glucagon: n = 13 at 4 mo after onset, n = 16 at all other time points. D: longitudinal fasting plasma ghrelin: n = 12. Values are means ± SE. One-way repeated measures ANOVA;, *P < 0.05, ** P < 0.001 compared with value at onset; ***P < 0.05 compared with value 1 mo before onset by Bonferroni's posttest.

References

    1. Anderwald C, Brabant G, Bernroider E, Horn R, Brehm A, Waldhausl W, Roden M. Insulin-dependent modulation of plasma ghrelin and leptin concentrations is less pronounced in type 2 diabetic patients. Diabetes 52: 1792–1798, 2003. - PubMed
    1. Bhargava SK, Sachdev HS, Fall CH, Osmond C, Lakshmy R, Barker DJ, Biswas SK, Ramji S, Prabhakaran D, Reddy KS. Relation of serial changes in childhood body-mass index to impaired glucose tolerance in young adulthood. N Engl J Med 350: 865–875, 2004. - PMC - PubMed
    1. Caluwaerts S, Holemans K, van Bree R, Verhaeqhe J, Van Assche F. Is low-dose streptozotocin in rats an adequate model for gestational diabetes? J Soc Gynecol Investig 10: 216–221, 2003. - PubMed
    1. Carmena R Type 2 diabetes, dyslipidemia, and vascular risk: rationale and evidence for correcting the lipid imbalance. Am Heart J 150: 859–870, 2005. - PubMed
    1. Chang AY Spontaneous diabetes in animals. Gen Pharmac 9: 447–450, 1978. - PubMed

Publication types

MeSH terms