

Gene expression changes in the course of normal brain aging are sexually dimorphic
- PMID: 18832152
- PMCID: PMC2563070
- DOI: 10.1073/pnas.0806883105
Gene expression changes in the course of normal brain aging are sexually dimorphic
Abstract
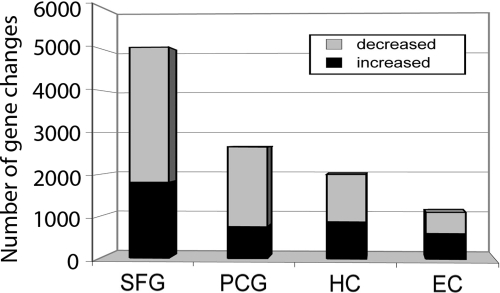
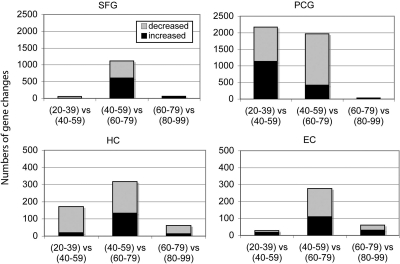
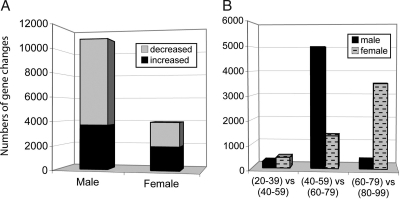
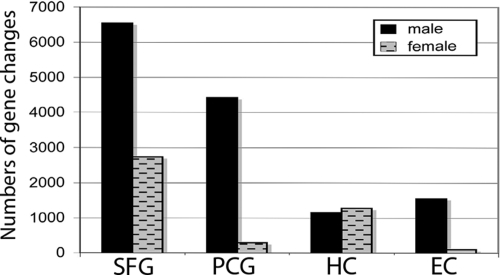
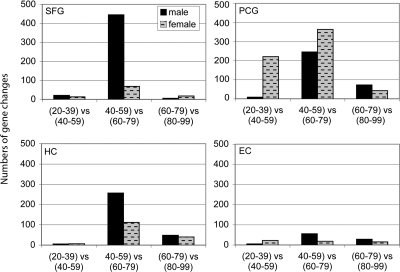
Gene expression profiles were assessed in the hippocampus, entorhinal cortex, superior-frontal gyrus, and postcentral gyrus across the lifespan of 55 cognitively intact individuals aged 20-99 years. Perspectives on global gene changes that are associated with brain aging emerged, revealing two overarching concepts. First, different regions of the forebrain exhibited substantially different gene profile changes with age. For example, comparing equally powered groups, 5,029 probe sets were significantly altered with age in the superior-frontal gyrus, compared with 1,110 in the entorhinal cortex. Prominent change occurred in the sixth to seventh decades across cortical regions, suggesting that this period is a critical transition point in brain aging, particularly in males. Second, clear gender differences in brain aging were evident, suggesting that the brain undergoes sexually dimorphic changes in gene expression not only in development but also in later life. Globally across all brain regions, males showed more gene change than females. Further, Gene Ontology analysis revealed that different categories of genes were predominantly affected in males vs. females. Notably, the male brain was characterized by global decreased catabolic and anabolic capacity with aging, with down-regulated genes heavily enriched in energy production and protein synthesis/transport categories. Increased immune activation was a prominent feature of aging in both sexes, with proportionally greater activation in the female brain. These data open opportunities to explore age-dependent changes in gene expression that set the balance between neurodegeneration and compensatory mechanisms in the brain and suggest that this balance is set differently in males and females, an intriguing idea.
Conflict of interest statement
The authors declare no conflict of interest.
Figures
References
-
- Pakkenberg B, et al. Aging and the human neocortex. Exp Gerontol. 2003;38:95–99. - PubMed
-
- Flood DG, Buell SJ, Horwitz GJ, Coleman PD. Dendritic extent in human dentate gyrus granule cells in normal aging and senile dementia. Brain Res. 1987;402:205–216. - PubMed
-
- Flood DG, Guarnaccia M, Coleman PD. Dendritic extent in human CA2–3 hippocampal pyramidal neurons in normal aging and senile dementia. Brain Res. 1987;409:88–96. - PubMed
-
- Bertoni-Freddari C, et al. Alterations of synaptic turnover rate in aging may trigger senile plaque formation and neurodegeneration. Ann NY Acad Sci. 2007;1096:128–137. - PubMed
-
- Lu T, et al. Gene regulation and DNA damage in the aging human brain. Nature. 2004;429:883–891. - PubMed
Publication types
MeSH terms
Associated data
- Actions
Grants and funding
LinkOut - more resources
Full Text Sources
Other Literature Sources
Medical
Molecular Biology Databases
