. 2008 Oct 7;105(40):15623-8.
doi: 10.1073/pnas.0808759105. Epub 2008 Oct 1.

The control of Ca2+ influx and NFATc3 signaling in arterial smooth muscle during hypertension

Affiliations

The control of Ca2+ influx and NFATc3 signaling in arterial smooth muscle during hypertension

Madeline Nieves-Cintrón et al. Proc Natl Acad Sci U S A. .

Abstract

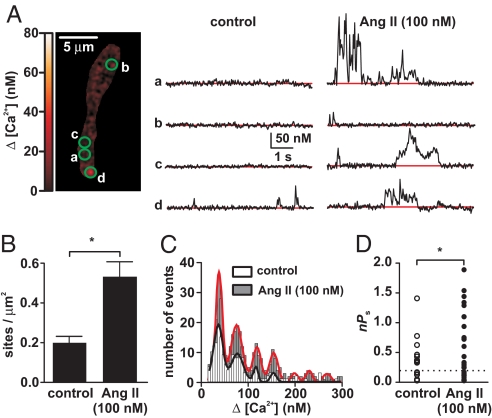
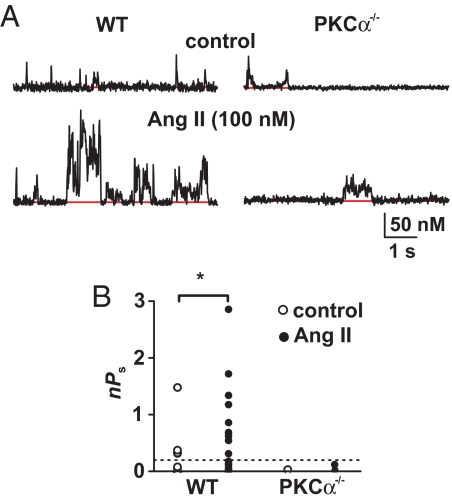
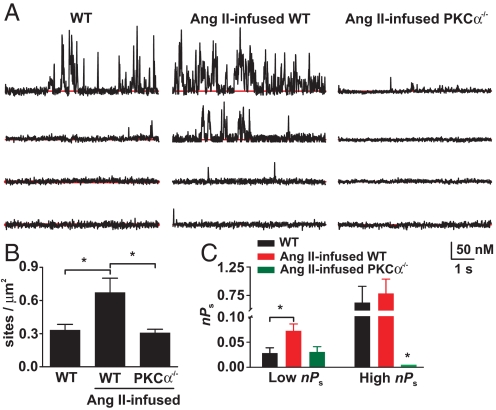
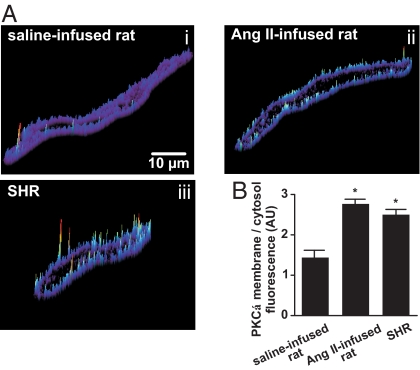
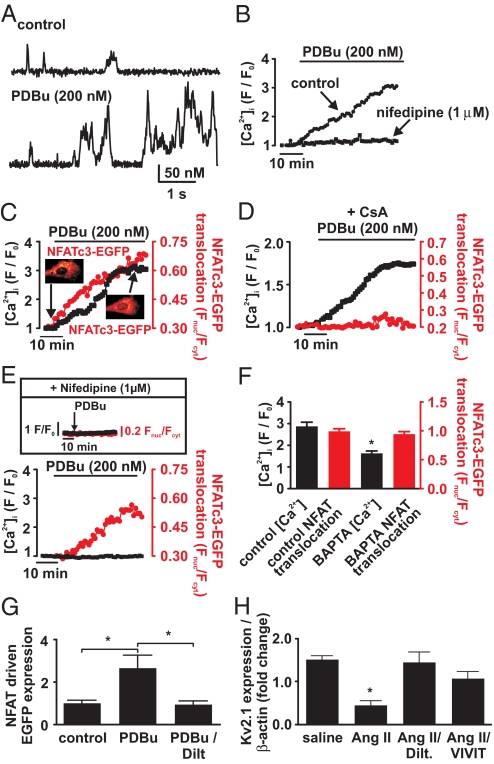
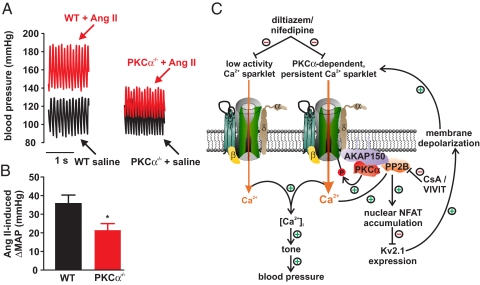
Many excitable cells express L-type Ca(2+) channels (LTCCs), which participate in physiological and pathophysiological processes ranging from memory, secretion, and contraction to epilepsy, heart failure, and hypertension. Clusters of LTCCs can operate in a PKCalpha-dependent, high open probability mode that generates sites of sustained Ca(2+) influx called "persistent Ca(2+) sparklets." Although increased LTCC activity is necessary for the development of vascular dysfunction during hypertension, the mechanisms leading to increased LTCC function are unclear. Here, we tested the hypothesis that increased PKCalpha and persistent Ca(2+) sparklet activity contributes to arterial dysfunction during hypertension. We found that PKCalpha and persistent Ca(2+) sparklet activity is indeed increased in arterial myocytes during hypertension. Furthermore, in human arterial myocytes, PKCalpha-dependent persistent Ca(2+) sparklets activated the prohypertensive calcineurin/NFATc3 signaling cascade. These events culminated in three hallmark signs of hypertension-associated vascular dysfunction: increased Ca(2+) entry, elevated arterial [Ca(2+)](i), and enhanced myogenic tone. Consistent with these observations, we show that PKCalpha ablation is protective against the development of angiotensin II-induced hypertension. These data support a model in which persistent Ca(2+) sparklets, PKCalpha, and calcineurin form a subcellular signaling triad controlling NFATc3-dependent gene expression, arterial function, and blood pressure. Because of the ubiquity of these proteins, this model may represent a general signaling pathway controlling gene expression and cellular function.


Conflict of interest statement

The authors declare no conflict of interest.

Figures

Fig. 1.
Fig. 1.
AngII increases Ca2+ sparklet activity. (A) Total internal reflection fluorescence (TIRF) image of an arterial myocyte (Left). Traces (Right) are time courses of [Ca2+]i in the sites indicated by the green circles before and after application of 100 nM AngII. (B) Ca2+ sparklet density before and after application of AngII. (C) Amplitude histogram of Ca2+ sparklets before and after AngII application. The black and red lines are the best fit to the control and AngII data, respectively, by using the Gaussian function. (D) nPs values for individual Ca2+ sparklet sites under control conditions and after application of AngII. The dashed line defines the threshold between low and high nPs sites.
Fig. 2.
Fig. 2.
AngII increases Ca2+ sparklet activity through the activation of PKCα. (A) Representative time course of [Ca2+]i in Ca2+ sparklet sites in WT and PKCα−/− cells before and after AngII (100 nM) treatment. (B) Scatter plot of nPs values for individual Ca2+ sparklet sites in WT and PKCα−/− cells under control conditions and after application of AngII.
Fig. 3.
Fig. 3.
Ca2+ sparklet activity is increased during AngII-induced hypertension. (A) Time courses of [Ca2+]i in a smooth muscle cell from saline and AngII-infused WT and PKCα−/− mice. (B) Bar plot of Ca2+ sparklet density. (C) Bar plot of nPs values for individual Ca2+ sparklet sites in smooth muscle cell from saline- and AngII-infused WT and PKCα−/− mice.
Fig. 4.
Fig. 4.
Increased PKCα activity during acquired and genetic hypertension. (A) Representative surface-plot of PKCα-associated fluorescence in cerebral artery myocytes from saline-infused rats, (Ai), AngII-infused rats, (Aii), and SHR (Aiii). (B) Bar plot of the PKCα membrane-to-cytosol fluorescence ratio from saline- and AngII-infused and SHR myocytes.
Fig. 5.
Fig. 5.
Activation of NFATc3 signaling by PKC-dependent local Ca2+ signals via LTCCs in human aortic myocytes. (A) Ca2+ sparklet records from a representative cell before and after 200 nM PDBu. (B) Global [Ca2+]i response to the application of PDBu during control conditions and in the presence of nifedipine (1 μM). (C and D) The time course of [Ca2+]i and nuclear NFATc3-EGFP translocation in response to PDBu or PDBu + CsA (1 μM), respectively. Insets in C show two NFATc3-EGFP images from this cell before and after application of PDBu. (E) Time course of [Ca2+]i and NFATc3-EGFP nuclear translocation in a cell loaded with BAPTA-AM after application of PDBu. The Inset shows global [Ca2+]i (black trace and left y axis; F/F0 units) and NFATc3-EGFP nuclear translocation (red trace and y axis; Fnuc/Fcyt units) in a cell exposed to PDBu (arrow) in the presence of nifedipine. (F) The bar plot of the peak [Ca2+]i and NFATc3-EGFP nuclear translocation during control conditions and in cells loaded with BAPTA-AM. (G) Bar plot of relative EGFP expression in human aortic smooth muscle cells cultured for 48 h under control conditions in the presence of PDBu (200 nM) and PDBu + diltiazem (10 μM). (H) Bar plot of the normalized (to β-actin) Kv2.1 transcript level in human aortic smooth muscle cells cultured for 48 h under control conditions with angiotensin II (100 nM), angiotensin II + diltiazem (10 μM), or angiotensin II + VIVIT (1 μM). Kv2.1 transcript levels were determined by real-time RT-PCR. *, P < 0.05.
Fig. 6.
Fig. 6.
PKCα is required for AngII-induced hypertension. (A) Representative pressure waveforms from WT and PKCα−/− mice before and after AngII infusion. (B) Bar plot of the change in mean arterial pressure (ΔMAP) induced by AngII in WT and PKCα−/− mice. (C) Proposed mechanism by which persistent Ca2+ sparklet activity increase tone and blood pressure during hypertension (see Discussion for details).

References

    1. MacMahon S, et al. Blood pressure, stroke, and coronary heart disease. Part 1, Prolonged differences in blood pressure: Prospective observational studies corrected for the regression dilution bias. Lancet. 1990;335:765–774. - PubMed
    1. Crowley SD, et al. Angiotensin II causes hypertension and cardiac hypertrophy through its receptors in the kidney. Proc Natl Acad Sci USA. 2006;103:17985–17990. - PMC - PubMed
    1. Rusch NJ, Hermsmeyer K. Calcium currents are altered in the vascular muscle cell membrane of spontaneously hypertensive rats. Circ Res. 1988;63:997–1002. - PubMed
    1. Ohya Y, Abe I, Fujii K, Takata Y, Fujishima M. Voltage-dependent Ca2+ channels in resistance arteries from spontaneously hypertensive rats. Circ Res. 1993;73:1090–1099. - PubMed
    1. Wang SQ, Song LS, Lakatta EG, Cheng H. Ca2+ signalling between single L-type Ca2+ channels and ryanodine receptors in heart cells. Nature. 2001;410:592–596. - PubMed

Publication types