. 2008 Nov;36(19):6260-8.
doi: 10.1093/nar/gkn511. Epub 2008 Oct 2.

G-quadruplexes: the beginning and end of UTRs

Affiliations

G-quadruplexes: the beginning and end of UTRs

Julian Leon Huppert et al. Nucleic Acids Res. 2008 Nov.

Abstract

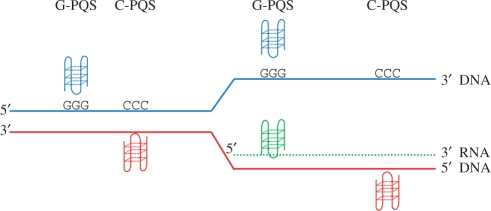
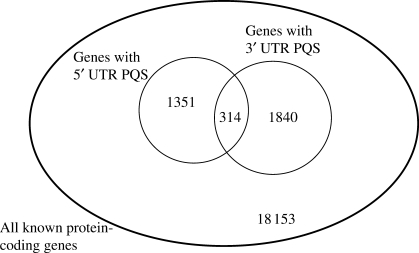
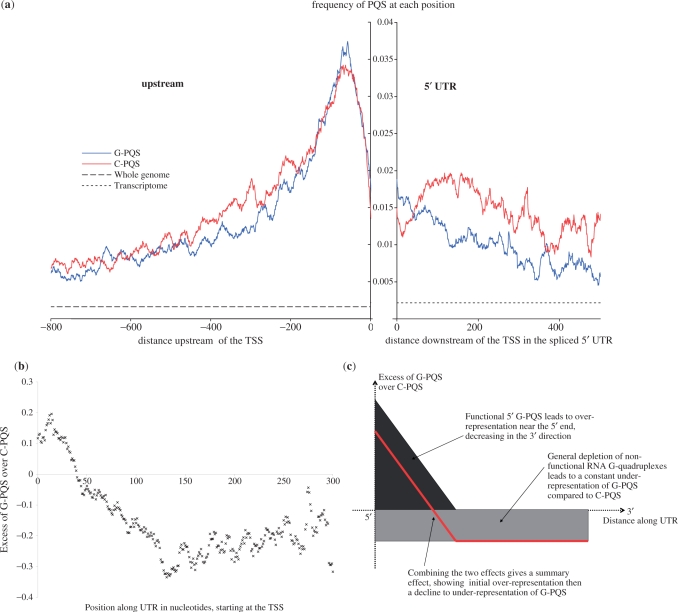
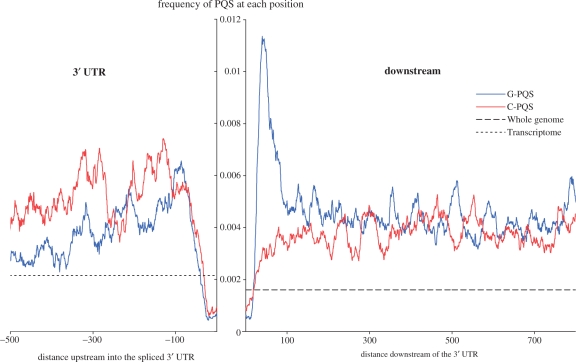
Molecular mechanisms that regulate gene expression can occur either before or after transcription. The information for post-transcriptional regulation can lie within the sequence or structure of the RNA transcript and it has been proposed that G-quadruplex nucleic acid sequence motifs may regulate translation as well as transcription. Here, we have explored the incidence of G-quadruplex motifs in and around the untranslated regions (UTRs) of mRNA. We observed a significant strand asymmetry, consistent with a general depletion of G-quadruplex-forming RNA. We also observed a positional bias in two distinct regions, each suggestive of a specific function. We observed an excess of G-quadruplex motifs towards the 5'-ends of 5'-UTRs, supportive of a hypothesis linking 5'-UTR RNA G-quadruplexes to translational control. We then analysed the vicinity of 3'-UTRs and observed an over-representation of G-quadruplex motifs immediately after the 3'-end of genes, especially in those cases where another gene is in close proximity, suggesting that G-quadruplexes may be involved in the termination of gene transcription.


Figures

Figure 1.
Figure 1.
Schematic of DNA and transcribed RNA. Where the DNA sequence in the coding strand (blue) is G-rich (shown as GGG) a DNA G-quadruplex could form in that strand, and is here referred to as a G-PQS. A C-rich region in the coding strand is shown equivalently as CCC, and would allow a G-quadruplex to form on the template strand (red) and is here referred to as a C-PQS. After transcription, G-PQS, but not C-PQS, also results in the formation of a G-quadruplex in the mRNA (green).
Figure 2.
Figure 2.
Venn diagram showing the number of genes with G-PQS in their 5′- and/or 3′-UTRs, compared to the number of genes studied. There is a significant overlap between the two sets.
Figure 3.
Figure 3.
(a) High-resolution map of PQS at the TSS junction. Distances are shown in units of bases in the 5′ direction (−ve) or 3′ direction (+ve). The frequencies represent the number of times a PQS was observed to include each individual base position, normalized for the number of times each position was observed. The equivalent frequencies across the whole genome and transcriptome are also shown for comparison. The upstream region is taken from whole genomic data, the 5′-UTR data is taken from the mature mRNA post-splicing, with a gap to highlight the junction. (b) Analysis of the excess of G-PQS over C-PQS for 5′-UTRs in the human genome, calculating the excess of G-PQS over C-PQS as Excess = (G-PQS − C-PQS)/(G-PQS + C-PQS) at every position along the 5′-UTR, counting in bases from the TSS. (c) A simple model to predict over-/under-representation of G-PQS motifs compared to C-PQS motifs suggests an overall profile given by the red line, in good agreement with the observed data.
Figure 4.
Figure 4.
Schematic of hypotheses for the roles of G-PQS associated with UTRs. (a) Presence of a stable RNA G-quadruplex, close to the 5′-cap, may prevent translation initiation by sterically blocking the association of the initiation complex at the 5′-cap or by disrupting the scanning process of the small ribosomal subunit towards the start codon. (b) G-quadruplex mediated pausing of the transcriptional complex at the 3′-end of the gene may facilitate trancription termination, leading to efficient cleavage at the polyadenylation site and polyadenylation.
Figure 5.
Figure 5.
High-resolution map of PQS at the TES junction. Distances are shown in units of bases in the 5′ direction (−ve) or 3′ direction (+ve). The frequencies represent the number of times a PQS was observed to include each individual base position, normalized for the number of times each position was observed. The equivalent frequencies across the whole genome and transcriptome are also shown for comparison. The downstream region is taken from whole genomic data, the 3′-UTR data is taken from the mature mRNA post-splicing, with a gap to highlight the junction.

References

    1. Pesole G, Mignone F, Gissi C, Grillo G, Licciulli F, Liuni S. Structural and functional features of eukaryotic mRNA untranslated regions. Gene. 2001;276:73–81. - PubMed
    1. Bartel DP. MicroRNAs: genomics, biogenesis, mechanism and function. Cell. 2004;116:281–297. - PubMed
    1. Wilkie GS, Dickson KS, Gray NK. Regulation of mRNA translation by 5′ and 3′-UTR-binding factors. Trends Bioc. Sci. 2003;28:182–188. - PubMed
    1. Mandal M, Breaker RR. Gene regulation by riboswitches. Nat. Rev. Mol. Cell Biol. 2004;5:451–463. - PubMed
    1. Kozak M. Structural features in eukaryotic mRNAs that modulate the initiation of translation. J. Biol. Chem. 1991;266:19867–19870. - PubMed

Publication types

Substances