. 2008 Nov;36(19):6269-83.
doi: 10.1093/nar/gkn636. Epub 2008 Oct 2.

Evolutionary origins of human apoptosis and genome-stability gene networks

Affiliations

Evolutionary origins of human apoptosis and genome-stability gene networks

Mauro A A Castro et al. Nucleic Acids Res. 2008 Nov.

Abstract

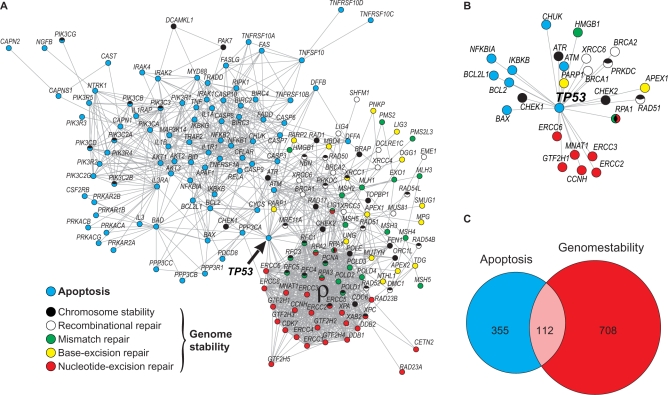
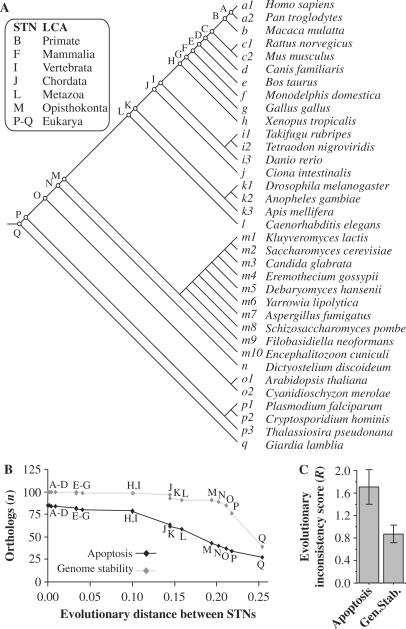
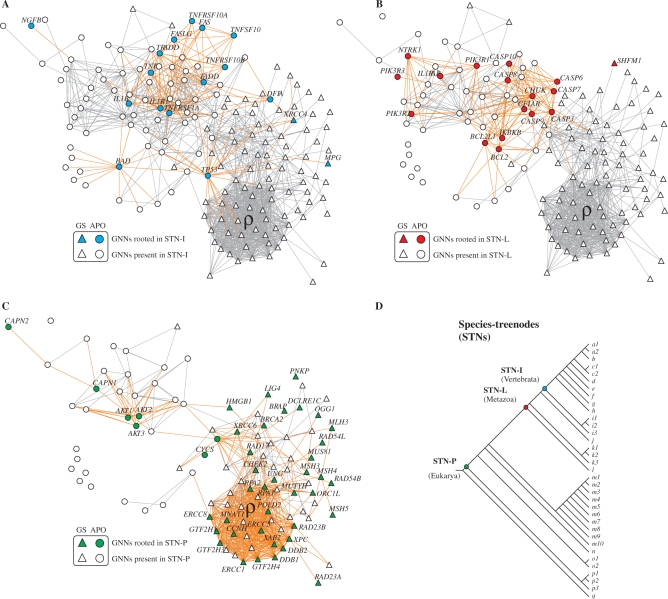
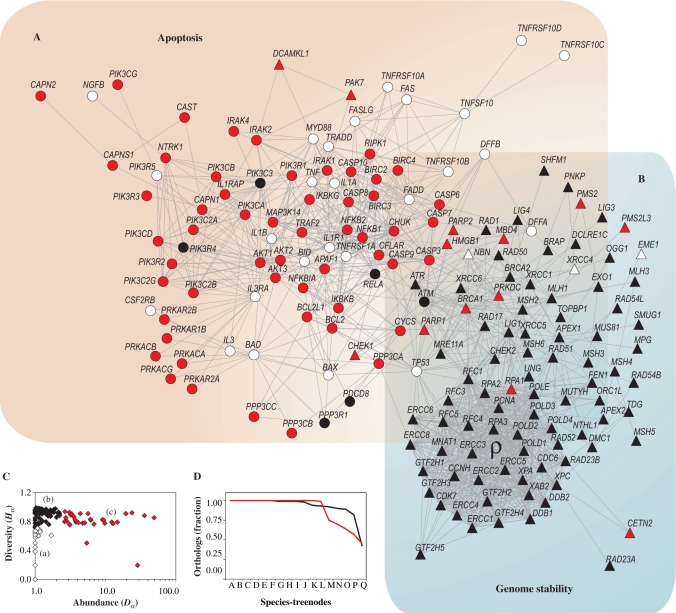
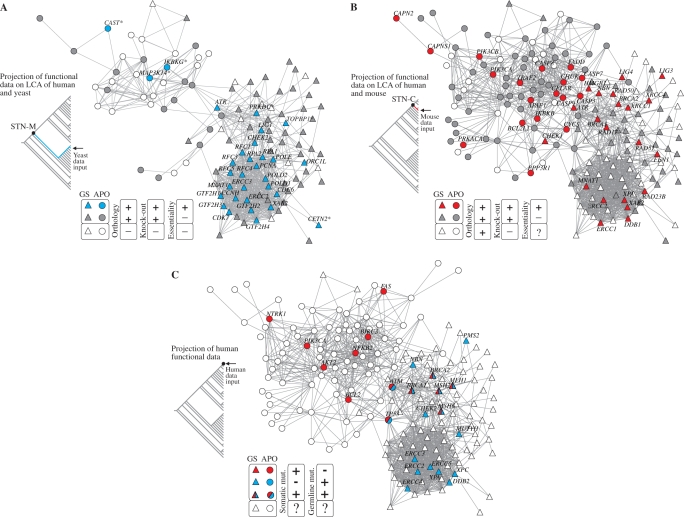
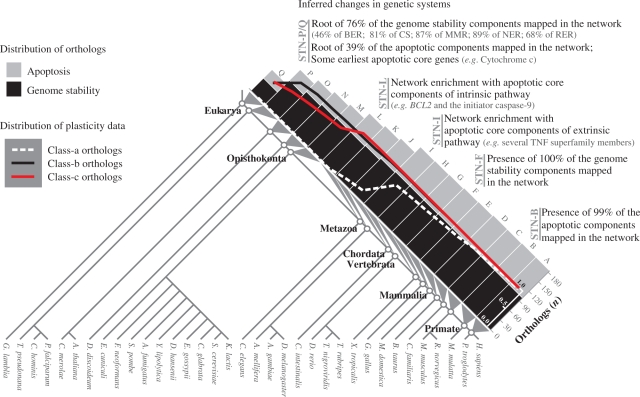
Apoptosis is essential for complex multicellular organisms and its failure is associated with genome instability and cancer. Interactions between apoptosis and genome-maintenance mechanisms have been extensively documented and include transactivation-independent and -dependent functions, in which the tumor-suppressor protein p53 works as a 'molecular node' in the DNA-damage response. Although apoptosis and genome stability have been identified as ancient pathways in eukaryote phylogeny, the biological evolution underlying the emergence of an integrated system remains largely unknown. Here, using computational methods, we reconstruct the evolutionary scenario that linked apoptosis with genome stability pathways in a functional human gene/protein association network. We found that the entanglement of DNA repair, chromosome stability and apoptosis gene networks appears with the caspase gene family and the antiapoptotic gene BCL2. Also, several critical nodes that entangle apoptosis and genome stability are cancer genes (e.g. ATM, BRCA1, BRCA2, MLH1, MSH2, MSH6 and TP53), although their orthologs have arisen in different points of evolution. Our results demonstrate how genome stability and apoptosis were co-opted during evolution recruiting genes that merge both systems. We also provide several examples to exploit this evolutionary platform, where we have judiciously extended information on gene essentiality inferred from model organisms to human.


Figures

Figure 1.
Figure 1.
Human apoptosis and genome-stability gene network. (A) Graph of interactions among genes involved in apoptosis and DNA repair pathways, as previously characterized in Castro et al. (19). Different pathways are represented in different colors. Network nodes with more than one color represent genes participating in more than one pathway. Gene IDs of each pathway are provided in Supplementary Table S1. (B) Magnification of TP53 gene position of in the network topology. It highlights the functional overlap of TP53, linking apoptosis to several genome-stability components. (C) Venn diagram showing the distribution of links between apoptosis and genome-stability pathways. The overlapped area corresponds to those links connecting both systems. The large number of associations among NER, MMR and chromosome-stability components is designed as ρ module.
Figure 2.
Figure 2.
Inferring evolutionary roots of human apoptosis and genome-stability genes. (A) Eukaryote species tree topology used in the parsimony analysis. The phylogenic relationship among these 35 eukaryotes is based on a manual integration of a variety of phylogenies (28–33). STNs and the corresponding LCA are indicated. (B) Distribution of apoptotic and of genome-stability orthologs according to the roots inferred in the species tree and plotted as a function of the divergence between STNs (based on branch-length estimates). In Supplementary Material Online we exemplified the parsimony analysis. The evolutionary distances were computed using three protein families regarded as very conserved among distant taxa and described as able to reconstruct the three-domain phylogeny: 40S ribosomal proteins, translation initiation factor 5A proteins and Flap structure-specific endonuclease 1 proteins (73). All proteins used in the analysis are aligned in Supplementary Figures S10–S12. The distances are expressed as the fraction of sites that differ between the branches in a multiple alignment, which is an approximation of the branch-length that separates STNs. (C) Divergence between KOG and Inparanoid-derived scenarios. For apoptosis genes, R = 1.709 STNs ±0.224 (SE) and for genome-stability genes R = 0.807 STNs ±0.202 (SE). It means that for each root inferred in our analyses, the estimated error for apoptosis is approximately two STNs up and down from the rooting point in the species tree, while for genome stability the error is approximately one STN up and down.
Figure 3.
Figure 3.
From STNs to gene-network nodes (GNNs). Orthology projection of genes rooted in STN-I (A), STN-L (B) and STN-P(C). Roots of an ortholog: color nodes; presence of an ortholog: white nodes. The location of these three STNs in the species tree is indicated (D). In Supplementary Material Online we provide further examples of this orthology projection approach (Supplementary Figure S2) and compared with Inparanoid evolutionary scenarios as a different orthology data source (Supplementary Figures S3–S6).
Figure 4.
Figure 4.
Plasticity analysis of orthologous groups. (A and B) Diversity Hα and abundance Dα of orthologous groups are overlaid on apoptosis and genome-stability gene network according to the categories defined in C. (C) Distribution of Hα as a function of Dα: (a) orthologous groups with low diversity and low abundance (white); (b) orthologous groups with high diversity and low abundance (black); (c) orthologous groups with high diversity and high abundance (red). (D) Fraction of orthologous groups present in the STNs: orthologous groups with low diversity and low abundance (white dashed line); orthologous groups with high diversity and low abundance (black solid line); and orthologous groups with high diversity and high abundance (red solid line). In Supplementary Material Online we provide examples of the diversity analysis.
Figure 5.
Figure 5.
Integrating evolutionary and functional data. (A) Projection of yeast lethality data onto human apoptosis and genome-stability gene network: essential (blue GNNs) and nonessential yeast orthologs (grey GNNs) according to SGD database (46). The graph presents all orthologs inferred in the LCA of yeast and human (i.e. rooted or present in STN-M). White GNNs correspond to genes present in the branch but absent in yeast, as predicted in the parsimony analysis (see ‘Materials and Methods’ section). Asterisks identify six GNNs whose orthology are predicted by orthologous groups but not confirmed in the Inparanoid database (47). (B) Projection of mouse lethality data onto human apoptosis and genome-stability gene network: essential (red GNNs) and nonessential (grey GNNs) mouse orthologs according to MGD database (45). The graph presents only GNNs whose orthologs are inferred in the LCA of mouse and human (i.e. rooted or present in STN-C). GNNs that lack knock-out data in MGD database are indicated as white GNNs (mainly in ρ module). (C) Projection of genes causally implicated in human cancer—CAN genes—according to Cancer Gene Census (48). Colors indicate whether the gene is somatically mutated in cancer (red GNNs) or mutated in germline predisposing to cancer (blue GNNs) or both. White GNNs indicate genes not mentioned in the Cancer Gene Census.
Figure 6.
Figure 6.
Summary of the inferred changes in genetic systems. The histograms show the distribution of 180 human orthologs according to the roots inferred in the eukaryote species tree (for details, see Figures 2 and 3). STNs and the corresponding LCA are indicated. Inset graph shows the presence fraction of orthologs of each STNs (for details, see Figure 4D). Diverse important events related to the roots of sets of genes are pointed along the STNs. Chromosome stability (CS).

References

    1. Danial NN, Korsmeyer SJ. Cell death: critical control points. Cell. 2004;116:205–219. - PubMed
    1. Lettre G, Hengartner MO. Developmental apoptosis in C. elegans: a complex CEDnario. Nat. Rev. Mol. Cell Biol. 2006;7:97–108. - PubMed
    1. Kanehisa M, Goto S, Hattori M, Aoki-Kinoshita KF, Itoh M, Kawashima S, Katayama T, Araki M, Hirakawa M. From genomics to chemical genomics: new developments in KEGG. Nucleic Acids Res. 2006;34:D354–D357. - PMC - PubMed
    1. Hipfner DR, Cohen SM. Connecting proliferation and apoptosis in development and disease. Nat. Rev. Mol. Cell Biol. 2004;5:805–815. - PubMed
    1. Crespi B, Summers K. Evolutionary biology of cancer. Trends Ecol. Evol. 2005;20:545–552. - PubMed

Publication types