. 2008 Nov 15;586(22):5487-502.
doi: 10.1113/jphysiol.2008.156224. Epub 2008 Oct 2.

Distinct expressions of contrast gain control in parallel synaptic pathways converging on a retinal ganglion cell

Affiliations

Distinct expressions of contrast gain control in parallel synaptic pathways converging on a retinal ganglion cell

Deborah Langrill Beaudoin et al. J Physiol. .

Abstract

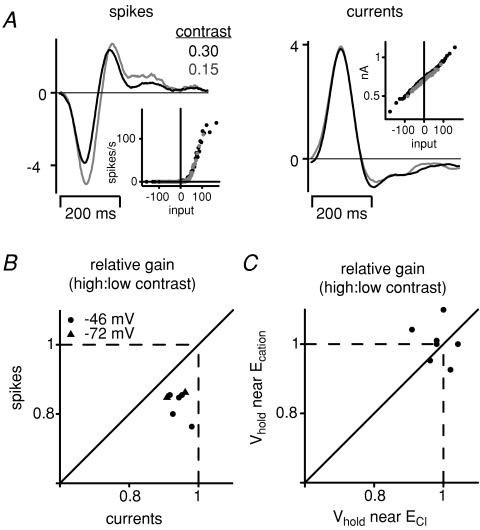
Visual neurons adapt to increases in stimulus contrast by reducing their response sensitivity and decreasing their integration time, a collective process known as 'contrast gain control.' In retinal ganglion cells, gain control arises at two stages: an intrinsic mechanism related to spike generation, and a synaptic mechanism in retinal pathways. Here, we tested whether gain control is expressed similarly by three synaptic pathways that converge on an OFF alpha/Y-type ganglion cell: excitatory inputs driven by OFF cone bipolar cells; inhibitory inputs driven by ON cone bipolar cells; and inhibitory inputs driven by rod bipolar cells. We made whole-cell recordings of membrane current in guinea pig ganglion cells in vitro. At high contrast, OFF bipolar cell-mediated excitatory input reduced gain and shortened integration time. Inhibitory input was measured by clamping voltage near 0 mV or by recording in the presence of ionotropic glutamate receptor (iGluR) antagonists to isolate the following circuit: cone --> ON cone bipolar cell --> AII amacrine cell --> OFF ganglion cell. At high contrast, this input reduced gain with no effect on integration time. Mean luminance was reduced 1000-fold to recruit the rod bipolar pathway: rod --> rod bipolar cell --> AII cell --> OFF ganglion cell. The spiking response, measured with loose-patch recording, adapted despite essentially no gain control in synaptic currents. Thus, cone bipolar-driven pathways adapt differently, with kinetic effects confined to the excitatory OFF pathway. The ON bipolar-mediated inhibition reduced gain at high contrast by a mechanism that did not require an iGluR. Under rod bipolar-driven conditions, ganglion cell firing showed gain control that was explained primarily by an intrinsic property.


Figures

Figure 1
Figure 1. The OFF ganglion cell integrates signals from multiple synaptic pathways
A, under dim light conditions, rod glutamate release drives ganglion cell responses through two pathways. The first, conventional rod pathway, starts with the rod (r1) and proceeds along two routes: a direct route, rod → rod bipolar (rb) → AII amacrine cell (AII) → ganglion cell (gc); and an indirect route, rod → rb → AII → OFF cone bipolar (cb) → gc. There is also an unconventional rod pathway, where a rod (r2) can synapse directly with an OFF cb. B, under bright light conditions, cone glutamate release drives ganglion cell responses through two pathways: an excitatory pathway, cone → OFF cb → OFF gc; and an inhibitory pathway, cone → ON cb → AII → OFF gc. The inhibitory pathway can take also an indirect route, where the AII synapses with the OFF cb. The direct inhibitory pathway does not require an ionotropic glutamate receptor (iGluR). Rod signals contribute to these pathways via electrical synapses (connexin 36, Cx36) with cones. Abbreviations: mGluR6, metabotropic glutamate receptor type 6; glycine-R, glycine receptor.
Figure 2
Figure 2. The linear–nonlinear (LN) model of the light response
A, the flickering stimulus is convolved with a linear filter. The resulting product is passed through a static nonlinearity to generate the model output. The model shown (filter and nonlinearity) was constructed from 50 s of data (Vhold=−45 mV). The nonlinearity is relatively straight under this condition but shows more rectification in other figures, where recordings are made at more negative holding potentials or in the presence of CNQX and d-AP-5. B, LN models were built for low and high contrast conditions. The model outputs are plotted with average responses (10 repeats) to 1 s of a 3 s, repeated stimulus. The method for testing the predictive ability of the LN model is described in Methods.
Figure 3
Figure 3. Ganglion cells can be voltage-clamped to measure either excitatory or inhibitory ligand-gated conductances
A, responses to puff application of kainate onto a ganglion cell at two Vhold values (−64 or +5 mV; average of eight puffs). Puff time is indicated by the arrow. Bottom trace shows that the kainate response is blocked by bath application of the AMPA-receptor antagonist GYKI (100 μm). Dashed lines show the leak current before the puff. B, I–V plot for the kainate response. Response is linear and reverses near 0 mV (Ecation). Points indicate the response to the puff, averaged over 200 ms near the peak of the response; error bars indicate s.e.m. across eight puff responses. The dashed line is a linear regression fit through the data. C, same format as A for puff application of glycine (average of seven puffs). The response is blocked by bath application of the glycine-receptor antagonist strychnine (2 μm). D, I–V plot for the glycine response. Response is outwardly rectifying and reverses near −67 mV, the calculated ECl. The dashed line is a fit through the data based on the Goldman–Hodgkin–Katz equation (Johnston & Wu, 1994). E, same format as A for puff application of baclofen (average of nine puffs).
Figure 4
Figure 4. Contrast-dependent changes in integration time are larger for excitatory currents than inhibitory currents
Aa and Ba, linear and nonlinear components of the model at two Vhold values. The initial 200 ms of the linear filter is shown on an expanded scale at right. The zero-crossing of the filter (arrow) was reduced at high contrast with Vhold near ECl but not with Vhold near Ecation. There was reduced gain at high contrast at both Vhold values. The nonlinearity changed from outwardly rectifying, at Vhold=−69 mV, to inwardly rectifying, at Vhold=−6 mV. Ab and Bb, traces showing the response to the first second of the repeated stimulus for both contrasts. C, relative gain at high contrast with Vhold near EClversus near Ecation (n = 8 cells). The reduced gain at high contrast was similar at the two Vhold values. D, relative zero-crossing time at high: low contrast (zchigh: zclow) with Vhold near EClversus near Ecation. The effect on integration time was more prominent at Vhold near ECl. The absolute zchigh was 95 ± 5 ms (n = 8) for Vhold near ECl and 89 ± 3 ms for Vhold near Ecation.
Figure 5
Figure 5. Responses driven by the ON cone bipolar cell/AII amacrine cell pathway adapt by reducing gain only
A and B, linear filters and nonlinearities measured at Vhold=−44 mV under a control condition and in the presence of bath-applied iGluR antagonists (200 μm CNQX and 200 μm d-AP-5). The initial 200 ms of the linear filter is shown on an expanded scale at right. The zero-crossing of the filter (arrow) was reduced at high contrast in the control condition but not in the CNQX/d-AP-5 condition. The reduced gain at high contrast was larger in the CNQX/d-AP-5 condition (0.55) relative to the control condition (0.72). The blockers had two effects on filter kinetics: increased oscillation and removal of the contrast-dependent shortening of integration time. C, relative gain for control and CNQX/d-AP-5 conditions (n = 9 cells). Vhold was −48 ± 4 mV (mean ±s.d.). The gain change was larger in the CNQX/d-AP-5 condition. D, relative zero-crossing time for the control and CNQX/d-AP-5 conditions. The contrast-dependent change in the zero-cross time was removed in the presence of CNQX and d-AP-5. The absolute zchigh was 84 ± 4 ms for the control condition and 90 ± 3 ms for the CNQX/d-AP-5 condition (n = 9).
Figure 6
Figure 6. Evidence that OFF ganglion cell responses depend strongly on the rod bipolar pathway at 10 R* per rod per second
A, ganglion cell responses to a dark flash (200 ms) over the receptive field centre (spot diameter, 0.6 mm) at three levels of background luminance. Responses were recorded at two Vhold values (−67 mV and −10 mV) under control conditions, after bath application of l-AP-4 (50 μm) and after washing out the drug. The response depended most strongly on excitation (i.e. inward current measured at −67 mV) under the brightest condition and most strongly on disinhibition (i.e. inward current measured at −10 mV) under the dimmest condition. l-AP-4 partially blocked excitatory currents and completely blocked inhibitory currents at all levels of mean luminance. B, average inward currents (periods indicated by grey strips in A) for the control (black) and l-AP-4 conditions (red) at each of three light levels and both Vhold values. Data points are average responses across 6 cells. Vertical error bars indicate s.e.m. across cells; horizontal error bars indicate s.d. of Vhold across cells.
Figure 7
Figure 7. Contrast adaptation in membrane currents is reduced at dim light levels that depend primarily on the rod bipolar pathway
A, linear filters and nonlinearities for high (104PR*) and low (10 PR*) mean luminance (Vhold=−53 mV). A twofold increase in contrast reduced gain more at 104PR* (0.74) than at 10 PR* (0.95). zchigh was longer at ∼10 PR* (188 ms) than at ∼104PR* (106 ms). Stimulus was updated at 20 Hz. B, relative gain at high contrast at two levels of mean luminance (n = 9 cells). Gain control was larger at the high mean luminance relative to lower mean luminance. C, relative zero-crossing time at high contrast at two levels of mean luminance. The shortening of zero-cross time was greater at the high mean luminance relative to the lower mean luminance. The absolute zchigh was 114 ± 2 ms for the high mean luminance condition and 170 ± 6 ms for the low mean luminance condition (n = 9).
Figure 8
Figure 8. At dim light levels, gain control can arise exclusively in the process of spike generation
A, linear filters and nonlinearities for the spiking and membrane current responses measured at two contrast levels (0.15 and 0.30) at a mean luminance of 10 PR*. At high contrast, the spike response reduced gain (0.76) but the current response showed essentially no change (0.98). Stimulus was updated at 20 Hz. B, relative gain at high contrast for spikes versus currents at a mean luminance of 10 PR*. In all cells, the gain change was larger for the spike response compared to the current response. Cells had Vhold near −46 or −72 mV (see Results). C, relative gain at high contrast for membrane currents recorded at two Vhold values. There was a similar lack of gain control in currents measured at Vhold values close to ECl (Vhold=−73 ± 4 mV) or Ecation (Vhold=−14 ± 7 mV; n = 7).
Figure 9
Figure 9. Detecting a contrast switch under dim light conditions requires integration over hundreds of rods
A, the intensity distribution in the random flicker stimulus is Gaussian, with a nominal σ/mean value, which defines the contrast. In this example, mean luminance is 10 R* per rod per second and intended σ values are 0.30 or 0.15 times the mean (high and low contrast, respectively). However, the distributions will ultimately be wider than intended because of shot noise associated with photon arrival times (where mean = variance of R*). Inset shows a Poisson distribution with mean = 5 R* per rod per second. B, simulation showing the effect of shot noise on isomerization rate over time. Each point in the simulation shows the R* value summed over a rod pool within each 50 ms frame (i.e. for the 20 Hz flicker stimulus used in the experiment). For a pool of 1000 rods, the two contrasts can be distinguished from one another and from 0% contrast (i.e. mean luminance); the summed isomerization rate resembles the stimulus. For a pool of 20 rods, the three contrast levels yield similar, noisy time courses. C, calculated σ/mean for two contrast levels and the mean luminance given various rod pools. The calculation is based on the experimental condition: mean luminance of 10 R* per rod per second and a frame length of 50 ms. Dashed lines indicate the Gaussian σ values. D, the ratio of σ/mean values for the two contrasts given various rod pool sizes. The mean was constant, so the ratio reduces to σ0.300.15. For a pool size of 20 rods, the twofold change in contrast yields only a 1.23-fold change in the σ0.300.15 ratio. For 1000 rods, the ratio approaches two. Dashed line indicates the two-fold change in the Gaussian σ.

References

    1. Baccus SA, Meister M. Fast and slow contrast adaptation in retinal circuitry. Neuron. 2002;36:909–919. - PubMed
    1. Beaudoin DL, Borghuis BG, Demb JB. Cellular basis for contrast gain control over the receptive field center of mammalian retinal ganglion cells. J Neurosci. 2007;27:2636–2645. - PMC - PubMed
    1. Belgum JH, Dvorak DR, McReynolds JS. Strychnine blocks transient but not sustained inhibition in mudpuppy retinal ganglion cells. J Physiol. 1984;354:273–286. - PMC - PubMed
    1. Benardete EA, Kaplan E. The dynamics of primate M retinal ganglion cells. Vis Neurosci. 1999;16:355–368. - PubMed
    1. Bloomfield SA, Dacheux RF. Rod vision: pathways and processing in the mammalian retina. Prog Retin Eye Res. 2001;20:351–384. - PubMed

Publication types