. 2008 Dec 1;586(23):5679-700.
doi: 10.1113/jphysiol.2008.155861. Epub 2008 Oct 2.

Autonomous initiation and propagation of action potentials in neurons of the subthalamic nucleus

Affiliations

Autonomous initiation and propagation of action potentials in neurons of the subthalamic nucleus

Jeremy F Atherton et al. J Physiol. .

Erratum in

  • J Physiol. 2009 Feb 1;587(Pt 3):709

Abstract

The activity of the subthalamic nucleus (STN) is intimately related to movement and is generated, in part, by voltage-dependent Na(+) (Na(v)) channels that drive autonomous firing. In order to determine the principles underlying the initiation and propagation of action potentials in STN neurons, 2-photon laser scanning microscopy was used to guide tight-seal whole-cell somatic and loose-seal cell-attached axonal/dendritic patch-clamp recordings and compartment-selective ion channel manipulation in rat brain slices. Action potentials were first detected in a region that corresponded most closely to the unmyelinated axon initial segment, as defined by Golgi and ankyrin G labelling. Following initiation, action potentials propagated reliably into axonal and somatodendritic compartments with conduction velocities of approximately 5 m s(-1) and approximately 0.7 m s(-1), respectively. Action potentials generated by neurons with axons truncated within or beyond the axon initial segment were not significantly different. However, axon initial segment and somatic but not dendritic or more distal axonal application of low [Na(+)] ACSF or the selective Na(v) channel blocker tetrodotoxin consistently depolarized action potential threshold. Finally, somatodendritic but not axonal application of GABA evoked large, rapid inhibitory currents in concordance with electron microscopic analyses, which revealed that the somatodendritic compartment was the principal target of putative inhibitory inputs. Together the data are consistent with the conclusions that in STN neurons the axon initial segment and soma express an excess of Na(v) channels for the generation of autonomous activity, while synaptic activation of somatodendritic GABA(A) receptors regulates the axonal initiation of action potentials.


Figures
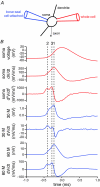
Figure 1
Figure 1. Loose-seal cell-attached recordings are related to the first temporal derivative of the action potential
A, schematic illustration of the recording configuration. Autonomously generated action potentials were recorded simultaneously from the soma of a STN neuron using a pipette in the whole-cell configuration (red pipette) and a pipette in the loose-seal cell-attached configuration (blue pipette). B, action potential-triggered averages of 100 action potentials recorded in the whole-cell (red traces) and loose-seal cell-attached (blue traces) configurations. Loose-seal cell-attached records were obtained for seal resistances of 30 and 80 MΩ, which approximate the range of resistances obtained with this technique. Note the alignment (line 1) of the peak of the first temporal derivative (dV/dt) of the whole-cell record and the loose-seal cell attached records. Note also the alignment of the first (line 2) and second (line 3) peaks of the second temporal derivative (d2V/dt2) of the somatic whole-cell record with the first and second peaks of the first temporal derivative (dV/dt) of the loose-seal cell-attached records, respectively. Similar results were obtained in each recorded neuron (n = 5).
Figure 2
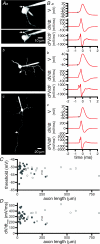
Figure 2. Action potentials are first detected in the proximal axon
A, action potential-triggered averages of 100 action potentials recorded with somatic whole-cell (red traces) and dendritic loose-seal cell-attached (blue traces) electrodes. Dendritic electrodes were positioned 100 μm (a) and 61 μm (b) from the soma. Note that the peak of the first temporal derivative of the dendritic loose-seal recording (blue dotted line) follows the first peak of the second temporal derivative of the whole-cell record (red dotted line) and the delay is greater for the more distal dendritic recording. B, action potential-triggered averages of 100 action potentials recorded with somatic whole-cell (red traces) and axonal loose-seal cell-attached (blue traces) electrodes. Axonal electrodes were positioned 54 μm (a), 277 μm (b) and 540 μm (c) distal to the soma. Note that the peak of the first temporal derivative of the most proximal axonal loose-seal recording (blue dotted line) precedes the first peak of the second temporal derivative of the whole-cell record (red dotted line). At more distal axonal recording sites action potentials were relatively delayed compared to somatic action potentials. C, latency of the first peak of the second derivative of the somatic action potential relative to the peak of the first derivative of the cell-attached record plotted against the distance of the loose-seal cell-attached recording electrode from the soma. Distances of cell-attached recordings from the soma are plotted as negative and positive for dendrites and axons, respectively. The points drawn from the examples shown in A and B are highlighted. Axonal recordings from sites of truncation or from intact parts of axons are denoted by light and dark grey points, respectively.
Figure 3
Figure 3. Golgi labelling of the axon initial segment
A and B, photomicrographs of STN neurons showing Golgi impregnation of the unmyelinated initial segment of the axon only. Golgi impregnation ceased 30.7 μm from the soma in A and 38.2 μm from the soma in B. The axons are marked with arrows. Bb and c, electron microscopic analysis of the neuron in Ba (and A, not illustrated) confirmed that Golgi labelling ceased at the beginning of the myelin sheath. Bb, low magnification electron micrograph illustrating capillaries (c1 and c2), which act as points of registration between the light (Ba) and electron micrographs (Bb and c). Bc, higher magnification micrograph illustrating the end of the Golgi-labelled axon initial segment and the beginning of the unlabelled myelinated section of axon. Golgi-labelled dendrites (d) act as further points of registration between Ba and c. Other unlabelled myelinated axons (a) are denoted in Bc. C, frequency–axon initial segment length histogram for 23 (11 adult, 12 juvenile) neurons. Mean ± s.d. is indicated above the graph.
Figure 4
Figure 4. Axonal expression pattern of ankyrin G
2PLSM images of biocytin- (red) and ankyrin G-labelled (green) STN neurons. Aa–c, ankyrin G labelling was detected along the axon initial segment (left arrows denote start and right arrows denote the end of labelling) and at the presumptive first node of Ranvier (arrowhead) of the biocytin-labelled neuron. The scale in Ac also applies to Aa and Ab. Ba–c, ankyrin G labelling at a proximal axonal branch point of another biocytin-labelled STN neuron (arrowhead). Scale bar in Bc also applies to a and b. Ba inset, full Z-stack through the axonal branch point.
Figure 5
Figure 5. Autonomously generated action potentials are faithfully propagated throughout axonal and somatodendritic compartments
Aa, Ba and Ca, maximum intensity projections of 2PLSM Z-series of STN neurons recorded simultaneously in the whole-cell somatic and loose-seal cell-attached axonal (Aa and Ba) or dendritic (Ca) configurations. Loose-seal cell-attached electrodes were placed 29 μm (Aa), 584 μm (Ba), and 117 μm (Ca) from the soma. Ab, Bb and Cb, corresponding whole-cell (upper panels) and loose-seal cell-attached records (lower panels). Autonomously initiated action potentials propagated with 100% reliability into somatic, distal axonal and distal dendritic compartments. Note that distal axonal and dendritic loose-seal cell-attached recordings were made beyond axonal and dendritic branch points. The amplitude of each somatic action potential was large and consistent in each neuron. The amplitudes of loose-seal cell-attached recorded axonal and dendritic action potentials were similarly consistent. Frequency/amplitude histograms together with fits (black line) to normal distributions are illustrated to the right of each recording.
Figure 6
Figure 6. Axonal truncation does not affect the shape, threshold or maximal rate of rise of autonomously generated action potentials
A, maximum intensity projections of 2PLSM Z-series through STN neurons with axons truncated at 24 μm (Aa) and 67 μm (Ab) or intact for at least 248 μm (Ac). An orthogonal projection is also illustrated for Aa. The scale bar in panel Ac also applies to Ab; axons are highlighted with arrows. B, spike-triggered averages of 100 action potentials taken from somatic whole-cell recordings from the cells shown in A. Dots mark threshold. The first and second derivatives of each trace are also shown. C, action potential thresholds for 39 neurons with axons truncated at varying lengths. D, maximum rate of rise (dV/dtmax) of action potentials from the same neurons, as shownin C. For both C and D, open symbols represent axons, which could not be followed for their entire length, the distance shown in these cases represents the maximum length of the axon that could be detected with 2PLSM. The lettered highlighted points (a-c) correspond to the cells shown in A and B. Note that the shape, threshold and maximum rate of rise of action potentials are similar for STN neurons with variable degrees of transection.
Figure 7
Figure 7. Reduction of extracellular [Na+] in the vicinity of the axon initial segment or cell body depolarizes the threshold of autonomously generated action potentials
A, effects of local application of low [Na+] ACSF at the soma (Aa), a dendrite (Ae), and at three axonal locations (Ab–d) on the autonomous generation of action potentials. Left-hand panels, overlaid traces from control trials (blue) and trials in which low [Na+] ACSF was pressure-pulse-applied for 50 ms (red traces; time of application marked with horizontal green bars). Middle panels, zoom of single action potentials from control (blue) and low [Na+] ACSF (red) trials aligned to the peak of each action potential. Action potential thresholds are marked with a dot on each trace. Right-hand panels, plots of the deviation of action potential threshold from mean threshold (measured in control traces) for all action potentials in 10 control trials (blue) and 10 trials of low [Na+] ACSF application (red). Applications of low [Na+] ACSF began at the start of the green bars. The length of the green bars approximates the duration of locally reduced extracellular [Na+] as assessed by the fluorescence of ejected Alexa Fluor 488. B, the sites of low [Na+] ACSF used in A superimposed on a maximum intensity projection of a 2PLSM Z-series of the neuron. Orthogonal (X and Y) projections are also illustrated. C, summary of the effect of low [Na+] ACSF application on action potential threshold in 8 cells. The data shown in black are from the example illustrated in A and B. Filled symbols represent sites of application that increased the threshold of action potentials compared to control trials, as measured by the Mann–Whitney U test. Open symbols represent sites of application that had no significant effect on threshold. D, mean ± s.d. effect of low [Na+] ACSF application on action potential threshold for dendritic, somatic and axonal sites.
Figure 8
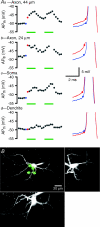
Figure 8. Proximal axonal and somatic application of TTX depolarizes the threshold of autonomously generated action potentials
A, responses of a representative neuron to 50 ms pressure applications of 1 μm TTX at two axonal sites (a, 44 μm from the soma; b, 24 μm from the soma), the soma (c), and a dendrite (d). The left-hand panels show the average action potential threshold (APth) from individual 1 s trials during which TTX was or was not applied. Trials were repeated every 30 s with 5 TTX trials interleaved with 5 control trials. Trials in which TTX was applied are marked with green bars. The blue and red dots correspond to examples in the right-hand panels. The right-hand panels show overlaid action potentials from control (blue) and TTX (red) trials. Dots denote threshold. B, the sites of TTX application in A (a-d) are superimposed on a maximum intensity projection of a 2PLSM Z-series of the neuron. Orthogonal (X and Y) projections are also illustrated.
Figure 9
Figure 9. Somatodendritic application of GABA evoked larger and faster GABAA receptor-mediated currents than axonal application of GABA
A, example recordings illustrating the effects of 10 ms pressure applications of 1 mm GABA to three axonal sites (a–c) and the soma (d). In current-clamp mode (left-hand panels), the greatest hyperpolarization was generated by application of GABA to the soma. The magnitude of hyperpolarization decreased with progressively more distal axonal applications of GABA. In voltage-clamp mode (holding voltage –70 mV; right-hand panels) outward current following application of GABA was greatest for somatic application and decreased in magnitude with progressively more distal axonal applications. B, maximum intensity projection of a 2PLSM Z-series of the neuron in A with locations of GABA application (a–d) highlighted. C–D, GABA application at the dendrite (1) and axon (2) of another STN neuron. C, maximum intensity projection of a 2PLSM Z-series of the neuron with locations of GABA application (1–2) highlighted. The neuron (red) was filled with Alexa Fluor 568 hydrazide. The GABA ejection pipettes (green) contained Alexa Fluor 488 hydrazide. E, population data, peak amplitude of outward current that was elicited following 10 ms applications of 1 mm GABA to dendritic, somatic and axonal (0–60 μm from soma) sites. F, population data, maximal rate of increase of GABA-evoked current (dI/dt max) for dendritic, somatic and axonal (0–60 μm from soma) sites of application.
Figure 10
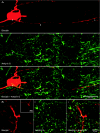
Figure 10. The soma, axon hillock and dendrites of Golgi-labelled STN neurons receive synaptic inputs from putative globus pallidus terminals
A–E, light (A) and electron (B–F) micrographs of the soma (s) and axon hillock (ah) of a Golgi-labelled neuron (the distal axon of this neuron is also illustrated in Figs 3B and 11). A capillary (c1) acts as a point of registration between the light and electron micrographs. C–E, the soma (C and D) and axon hillock (E) of this neuron received synaptic input (arrows) from terminals (asterisks) that possessed the morphological properties of terminals arising from GABAergic globus pallidus neurons, i.e. they were large, formed multiple symmetrical synaptic junctions and contained multiple mitochondria. C and D, serial sections through the same axosomatic terminal. E, the axo-axonic synapse was established on the axon hillock ∼2–3 μm from the soma. F, an example of another globus pallidus-like terminal (asterisk) that formed multiple symmetrical synaptic contacts (arrows) with the dendrite (d) of another Golgi-labelled STN neuron. Scale bar in C also applies to D–F.
Figure 11
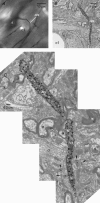
Figure 11. The axon initial segment is largely devoid of synaptic input
A–C, light (A) and electron (B and C) micrographs of the axon initial segment (ais) of the Golgi-labelled neuron illustrated in Figs 3B and 10AE. The capillary (c1) acts as a point of registration between the light and electron micrographs. Although the axon hillock received an input from a putative globus pallidus terminal (Fig. 10E), the remaining axon initial segment did not receive synaptic input. At high magnification (C), the axon can be observed to course through neuropil in which adjacent axons (a), dendrites (d), synaptic terminals (asterisks) and synapses (arrows) with other elements are present.

Comment in

Similar articles

Cited by

References

    1. Afsharpour S. Light microscopic analysis of Golgi-impregnated rat subthalamic neurons. J Comp Neurol. 1985;236:1–13. - PubMed
    1. Albin RL, Young AB, Penney JB. The functional anatomy of basal ganglia disorders. Trends Neurosci. 1989;12:366–375. - PubMed
    1. Alle H, Geiger JR. Combined analog and action potential coding in hippocampal mossy fibers. Science. 2006;311:1290–1293. - PubMed
    1. Alvarez L, Macias R, Lopez G, Alvarez E, Pavon N, Rodriguez-Oroz MC, Juncos JL, Maragoto C, Guridi J, Litvan I, Tolosa ES, Koller W, Vitek J, DeLong MR, Obeso JA. Bilateral subthalamotomy in Parkinson's disease: initial and long-term response. Brain. 2005;128:570–583. - PubMed
    1. Astman N, Gutnick MJ, Fleidervish IA. Persistent sodium current in layer 5 neocortical neurons is primarily generated in the proximal axon. J Neurosci. 2006;26:3465–3473. - PMC - PubMed

Publication types

MeSH terms

LinkOut - more resources