. 2008 Dec;18(12):1991-2004.
doi: 10.1101/gr.077693.108. Epub 2008 Oct 2.

Finding friends and enemies in an enemies-only network: a graph diffusion kernel for predicting novel genetic interactions and co-complex membership from yeast genetic interactions

Affiliations

Finding friends and enemies in an enemies-only network: a graph diffusion kernel for predicting novel genetic interactions and co-complex membership from yeast genetic interactions

Yan Qi et al. Genome Res. 2008 Dec.

Abstract

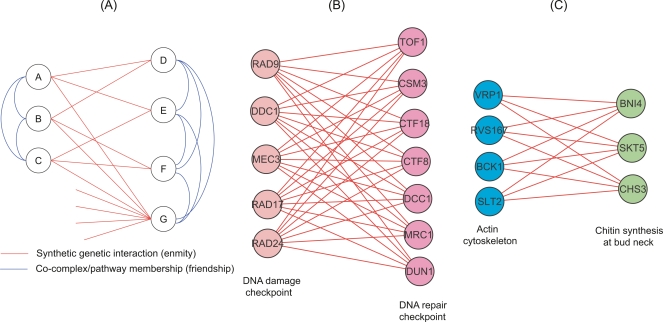
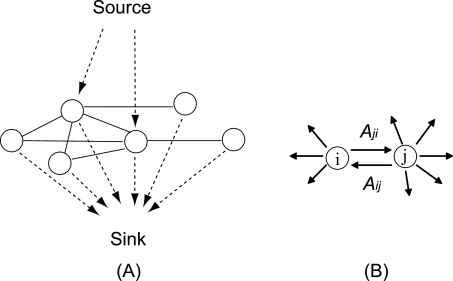
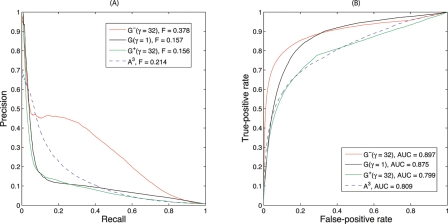
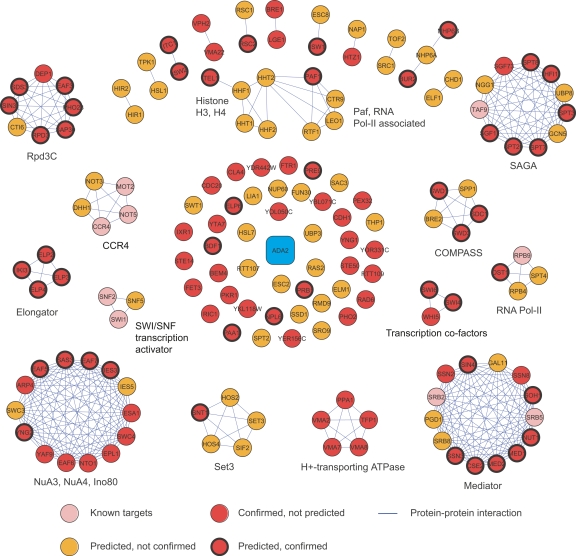
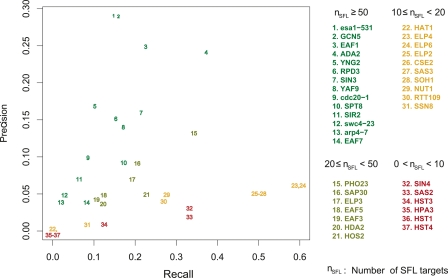
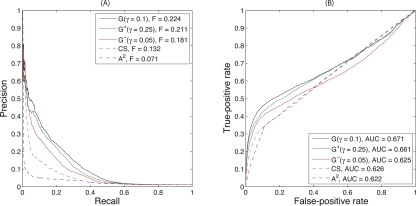
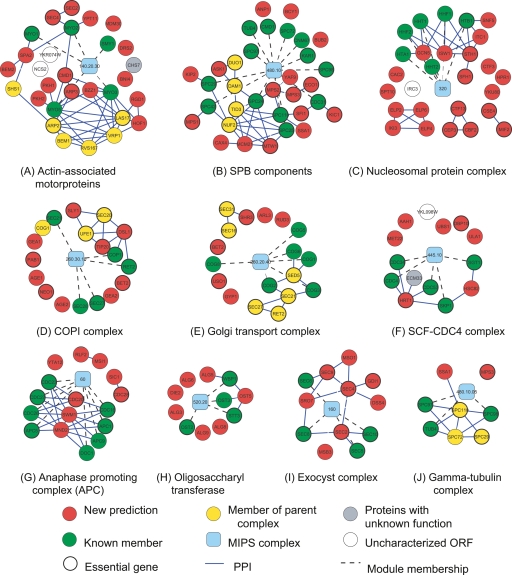
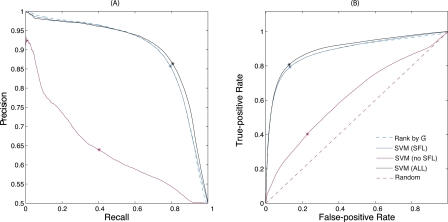
The yeast synthetic lethal genetic interaction network contains rich information about underlying pathways and protein complexes as well as new genetic interactions yet to be discovered. We have developed a graph diffusion kernel as a unified framework for inferring complex/pathway membership analogous to "friends" and genetic interactions analogous to "enemies" from the genetic interaction network. When applied to the Saccharomyces cerevisiae synthetic lethal genetic interaction network, we can achieve a precision around 50% with 20% to 50% recall in the genome-wide prediction of new genetic interactions, supported by experimental validation. The kernels show significant improvement over previous best methods for predicting genetic interactions and protein co-complex membership from genetic interaction data.


Figures

Figure 1.
Figure 1.
The parallel pathway model in the synthetic genetic interaction network. (A) A synthetic genetic interaction network is analogous to a social network of enemies. The two branches represent genes in parallel pathways, analogous to people in competing social groups. Nodes within the same branch are friends (or members of the same pathway), while nodes in different branches are enemies (or genes with a synthetic lethal genetic interaction). (B) The functionally overlapping DNA damage checkpoint genes and DNA repair checkpoint genes have enriched between-pathway SFL interactions (Pan et al. 2006). (C) Two groups of cell cortex genes have enriched between-pathway SFL interactions (Kelley and Ideker 2005).
Figure 2.
Figure 2.
Diffusion of a hypothetical fluid on a graph. (A) Diffusion with source and sink. Fluid is pumped from the source into a selected set of query nodes and is allowed to leak out from each node into a sink at first-order rate γ. For clarity, an undirected network is shown. (B) Diffusion between two nodes in a directed network. Fluid diffuses in both directions according to the two edge weights between nodes i and j. A directed network is shown for generality.
Figure 3.
Figure 3.
Performance of predicting genetic interactions from BioGRID by three diffusion kernels and the raw counts of length-3 paths. The optimal diffusion parameters used are γ = 32 for G, γ = 1 for G and γ = 32 for G+. The raw counts of length-3 paths is A3. The odd-parity diffusion kernel G significantly outperforms all other methods. (A) Precision-recall curves. (B) Receiver operating characteristic curves.
Figure 4.
Figure 4.
SFL targets of ADA2 were obtained by combining high-throughput screening results and predictions by the odd-parity kernel G, validated by random spore analysis or tetrad dissection. (Confirmed) Experimentally tested positive. Protein–protein interactions are derived from the MIPS database and Krogan et al. (2006) and Gavin et al. (2006). The SFL targets of ADA2 are most enriched of histone and chromatin modification complexes and the mRNA transcription machinery.
Figure 5.
Figure 5.
Precision and recall for the top 100 SFL predictions for 37 query genes at γ = 1 by the G kernel. Query genes are color coded according to the number of SFL partners from a recent screen (Lin et al. 2008).
Figure 6.
Figure 6.
Optimal γ parameters for predicting new SFL partners using G are query-specific. Performance assessed by F-score is positively correlated with γ.
Figure 7.
Figure 7.
Performance of co-complex/pathway membership prediction by three diffusion kernels, congruence score, and the raw counts of length-2 paths. Complex data are obtained from the MIPS protein complex database (Mewes et al. 2004). The optimal diffusion parameters used are γ = 0.25 for G+, γ = 0.1 for G and γ = 0.05 for G. (CS) Congruence score; (A2) raw counts of length-2 paths. (A) Precision-recall curves. (B) Receiver operating characteristic curves.
Figure 8.
Figure 8.
Gene Ontology (GO) semantic similarity correlation with score percentile. Cumulative average semantic similarity correlations between score percentile and each of the three GO categories—(A) molecular function, (B) biological process, and (C) cellular component. (CS) Congruence score. GO annotations for yeast genes are downloaded from the Saccharomyces Genome Database (SGD). Diffusion kernel scores optimized for predicting co-complex membership were used (γ + 0.25, 0.1, 0.05 for G+, G, and G). See text for details.
Figure 9.
Figure 9.
Modules from complex-based search. Cyan nodes (module) are labeled with the ID of the MIPS complex used as query. Known members of the query complex with no SFL interaction in our training set are not shown. (Blue edges) Physical interactions absent from MIPS but present in high-throughput data (Gavin et al. 2006; Krogan et al. 2006; Stark et al. 2006). Physical interactions between known members are not shown.
Figure 10.
Figure 10.
Results of SFL prediction with and without data integration. Four features—three derived from protein–protein interactions and one obtained from Gene Ontology annotations—were used in data integration by the support vector machine (SVM). The G scores used in direct ranking and for the SVM were obtained with γ = 32. (*) The results of the SVM classification. See text for details. (A) Precision-recall curves of four methods. The SVM classifier that integrates additional features with G performs the best. (B) Receiver-operator characteristic curves of four methods. The SVM classifier that integrates additional features with G performs the best.

References

    1. Asthana S., King O.D., Gibbons F.D., Roth F.P. Predicting protein complex membership using probabilistic network reliability. Genome Res. 2004;14:1170–1175. - PMC - PubMed
    1. Bandyopadhyay S., Kelley R., Krogan N.J., Ideker T. Functional maps of protein complexes from quantitative genetic interaction data. PLoS Comput. Biol. 2008;4:e1000065. doi: 10.1371/journal.pcbi.1000065. - DOI - PMC - PubMed
    1. Boser B.E., Guyon I.M., Vapnik V.N. COLT ’92: Proceedings of the Fifth Annual Workshop on Computational Learning Theory. ACM; New York: 1992. A training algorithm for optimal margin classifiers; pp. 144–152.
    1. Brin S., Page L. The anatomy of a large-scale hypertextual web search engine. Comput. Netw. ISDN Syst. 1998;30:107–117.
    1. Chua H.N., Sung W.K., Wong L. Exploiting indirect neighbours and topological weight to predict protein function from protein–protein interactions. Bioinformatics. 2006;22:1623–1630. - PubMed

Publication types

MeSH terms

Substances

LinkOut - more resources