. 2008 Nov;173(5):1311-25.
doi: 10.2353/ajpath.2008.080272. Epub 2008 Oct 2.

Adenoviral overexpression and small interfering RNA suppression demonstrate that plasminogen activator inhibitor-1 produces elevated collagen accumulation in normal and keloid fibroblasts

Affiliations

Adenoviral overexpression and small interfering RNA suppression demonstrate that plasminogen activator inhibitor-1 produces elevated collagen accumulation in normal and keloid fibroblasts

Tai-Lan Tuan et al. Am J Pathol. 2008 Nov.

Abstract

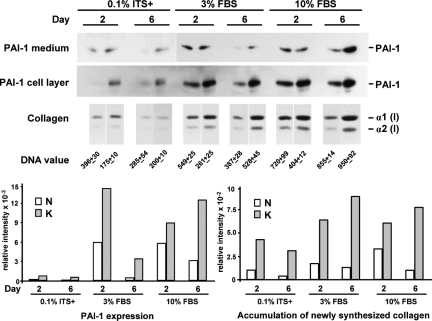
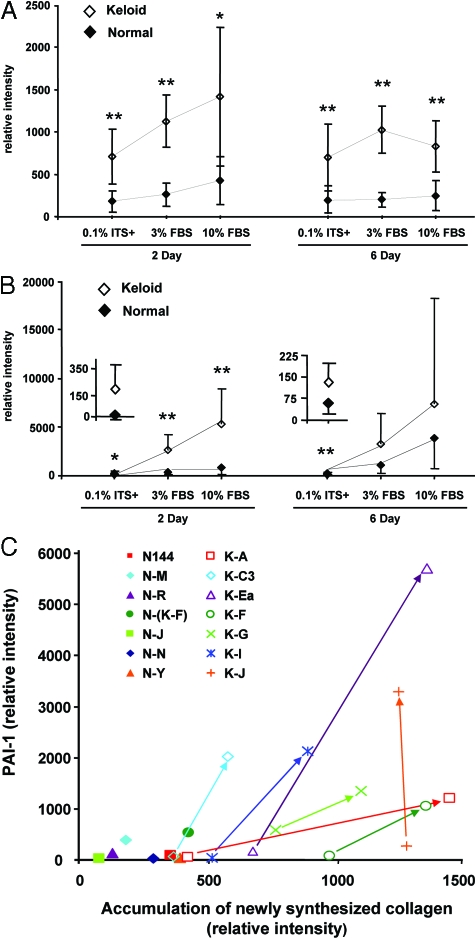
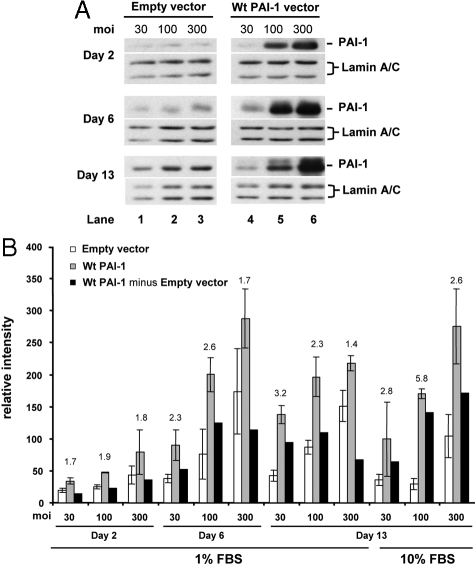
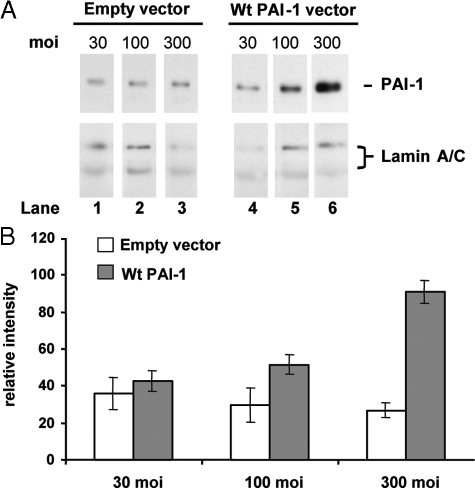
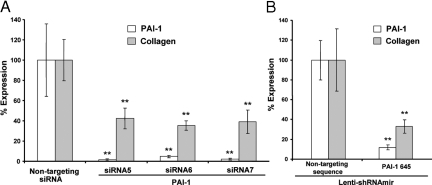
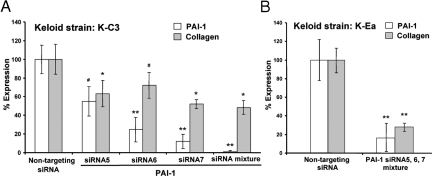
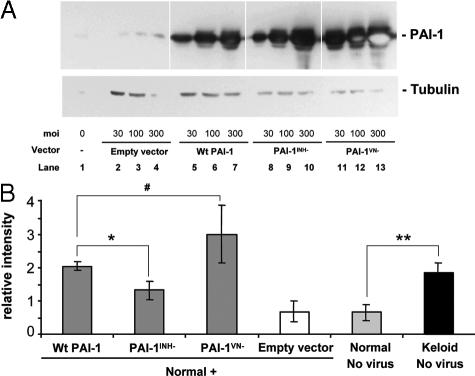
Keloids are tumor-like skin scars that grow as a result of the aberrant healing of skin injuries, with no effective treatment. We provide new evidence that both overexpression of plasminogen activator inhibitor-1 (PAI-1) and elevated collagen accumulation are intrinsic features of keloid fibroblasts and that these characteristics are causally linked. Using seven strains each of early passage normal and keloid fibroblasts, the keloid strains exhibited inherently elevated collagen accumulation and PAI-1 expression in serum-free, 0.1% ITS+ culture; larger increases in these parameters occurred when cells were cultured in 3% serum. To demonstrate a causal relationship between PAI-1 overexpression and collagen accumulation, normal fibroblasts were infected with PAI-1-expressing adenovirus. Such cells exhibited a two- to fourfold increase in the accumulation of newly synthesized collagen in a viral dose-dependent fashion in both monolayers and fibrin gel, provisional matrix-like cultures. Three different PAI-1-targeted small interfering RNAs, alone or in combination, produced greater than an 80% PAI-1 knockdown and reduced collagen accumulation in PAI-1-overexpressing normal or keloid fibroblasts. A vitronectin-binding mutant of PAI-1 was equipotent with wild-type PAI-1 in inducing collagen accumulation, whereas a complete protease inhibitor mutant retained approximately 50% activity. Thus, PAI-1 may use more than its protease inhibitory activity to control keloid collagen accumulation. PAI-1-targeted interventions, such as small interfering RNA and lentiviral short hairpin RNA-containing microRNA sequence suppression reported here, may have therapeutic utility in the prevention of keloid scarring.


Figures

Figure 1
Figure 1
Comparison of PAI-1 protein and accumulation of newly synthesized collagen between a pair of keloid (strain K-C3) and normal (strain N-M) fibroblasts best matched in donor age, ethnic background, and anatomical location (Table 1). Each protein band represents the physical pool of triplicate samples. Medium and cell layer fractions were analyzed separately for PAI-1 protein expression and combined for collagen accumulation. The images from 1-hour exposure of PAI-1 Western blots are presented for cell layer samples, and 10-minute images are presented for medium samples, except the 0.1% ITS samples (also 1 hour). Tritiated proline fluorographic images of pepsin-treated collagen after SDS-PAGE are presented for all collagen samples. DNA values (mean of triplicate samples ± SD) from parallel cultures were used for normalization of the relative intensities of PAI-1 and collagen [α1(I)] bands obtained by digital image analysis. PAI-1 values from the medium and cell layer were combined for the normalized bar graphs that summarize these results (bottom panel). PAI-1 = 47 kDa.
Figure 2
Figure 2
Comparison of accumulation of newly synthesized collagen (A) and PAI-1 expression (B) between seven strains each of freshly isolated and low passage (≤2) keloid and normal fibroblast cultures. Fibroblasts were cultured in 0.1% ITS+, 3% FBS, or 10% FBS for 2 or 6 days. Triplicate samples were analyzed as a physical pool for each cell strain as described in the legend to Figure 1. The relative intensities of PAI-1 and collagen [α1(I)] bands from both the medium and cell layer were quantified by digital image analysis and normalized with cellular DNA content. Digital image analysis was based on pairwise determination of band intensity from multiple film exposures. Samples common to each pair of gels were included to enable comparison between gels in the same experiment and between gels of all cell strains. Each point represents the mean ± SD from seven strains each of normal or keloid fibroblasts and includes the strains analyzed in Figure 1. ⋄, Keloid fibroblasts; ♦, normal fibroblasts. Insets contain a magnified scale for data points from normal and keloid fibroblasts cultured in 0.1% ITS+. *P ≤ 0.05; **P ≤ 0.01. Plots of strain-specific data are presented as a supplement (Supplemental Figure S1, A and B). C: A combined plot of PAI-1 and collagen strain-specific data for normal and keloid fibroblasts analyzed on day 2 after culture in ITS+ or 3% FBS. For each keloid strain, the data point for culture in ITS+ is connected to that in 3% FBS by an arrow originating at the ITS+ point. The angled arrows indicate simultaneous increases in both the PAI-1 and collagen parameters. Because all data from normal strains in ITS+ fell closer to the origin than the corresponding data from normal strains in 3% FBS, only the data from the more stimulatory 3% FBS culture of normal cells are presented. Normal fibroblast strains, filled symbols; keloid fibroblast strains, open symbols, +, ×, and *. Strain identifiers are presented in the legend and in Table 1.
Figure 3
Figure 3
PAI-1 overexpression stimulates accumulation of newly synthesized collagen in normal fibroblasts infected with adenoviral vector carrying the wild-type PAI-1 gene. Normal fibroblasts from the N144 strain were infected with empty vector (control) and Wt PAI-1 adenovirus at 30, 100, or 300 moi for 24 hours in 0.1% ITS+ before culturing in 1% FBS for 2, 6, or 13 days or in 10% FBS for 13 days. A: Western blots of PAI-1 protein expression (cell layer) under 1% FBS use the nuclear envelope proteins Lamin A/C as loading controls and represent the physical pool of triplicate samples. B: Analyses of accumulation of newly synthesized collagen use DNA content for normalization and represent the separate analysis of triplicate samples (□, empty vector; ░⃞, Wt PAI-1 vector; ▪, Wt PAI-1 minus Empty vector). The results represent the means ± SD. PAI-1 = 47 kDa; Lamin A/C = 74/65 kDa.
Figure 4
Figure 4
PAI-1 protein overexpression in normal fibroblasts (N144) stimulates collagen accumulation in fibrin gels. Fibroblasts in fibrin gels were transduced with 30,100, and 300 moi of Wt PAI-1 or empty adenoviral vectors and cultured in 3% FBS for 6 days. A: Western blots of PAI-1 protein from the medium fraction. Each protein band represents a physical pool of triplicates samples. Lamin A/C was used as a loading control. B: Accumulation of newly synthesized collagen. Each data point represents the DNA normalized mean of triplicate separately analyzed samples ± SD (□, empty vector;, Wt PAI-1 vector).
Figure 5
Figure 5
PAI-1 siRNA and shRNAmir suppress the level of PAI-1 protein in normal fibroblasts (N144) transduced with Ad-Wt PAI-1 (100 moi) and reduce collagen accumulation. A: Normal fibroblasts plated at confluent density were transfected with the indicated PAI-1 siRNAs (100 nmol/L) for 24 hours in 10% FBS, then infected with Wt PAI-1 adenoviral vector for 24 hours in 0.1% ITS+, and cultured in 3% FBS for 6 days. Data are presented as the percent expression relative to the effects of the nontargeting control sequence. □, Expression of PAI-1 in the medium presented as the mean ± SD of DNA normalized data (n = 3)., Accumulation of newly synthesized collagen; n = 3, data handling as in A. B:. Normal fibroblast were infected with a pGIPZ lentiviral vector expressing a shRNAmir targeted to PAI-1, PAI-1–645, or a nontargeting sequence, selected with puromycin, verified by GFP expression, infected with Ad-Wt PAI-1, and cultured as described in A. Nontargeting siRNA: mammalian nontargeting siRNA sequence; PAI-1 siRNAs: siRNA5, siRNA6, or siRNA7. **P ≤ 0.01.
Figure 6
Figure 6
Keloid fibroblasts (K-C3 and K-Ea) respond to PAI-1 siRNA with decreased PAI-1 and collagen accumulation. Culture, treatment, and data handling were as in Figure 5A. □, PAI-1 expression., Collagen accumulation. A: Keloid strain K-C3. B: Keloid strain K-Ea. PAI-1 siRNAs: siRNA5, siRNA6, or siRNA7; siRNA Mixture: a mixture of siRNA5, siRNA6, and siRNA7 (a total of 100 nmol/L). *P ≤ 0.05; **P≤ 0.01; #P ∼ 0.1.
Figure 7
Figure 7
PAI-1 protein expression and collagen accumulation in N144 normal fibroblasts infected with adenoviral vectors carrying wild-type PAI-1 or mutant genes. The protease inhibitor mutant (PAI-1INH−), vitronectin-binding mutant (PAI-1VN−), or Wt PAI-1 adenoviral vectors at 30,100, and 300 moi were used to infect cells for 24 hours in 0.1% ITS+ before 6 days of culture in 3% FBS. A: PAI-1 protein expression was analyzed by Western blotting with α-tubulin (52 kDa) as the loading control. Empty vector was used as the control. Each protein band represents a physical pool of triplicates samples. Light spots inside the PAI-1 protein bands in lanes 12 and 13 indicate local exhaustion of chemiluminescent substrate. B: Accumulation of newly synthesized collagen as analyzed in Figure 5. Keloid strain K-C3 was used for comparison with normal strain N144 and N144 transduced with empty vector or viruses expressing wild-type and mutant PAI-1 at 100 moi during infection and culture as in A. n = 3, *P ≤ 0.05; **P ≤ 0.01; #P = 0.13.
Figure 8
Figure 8
PAI-1-specific protease inhibitory activity of PAI-1 protein from normal fibroblasts (N144) infected with adenoviral vectors expressing Wt PAI-1, PAI-1INH−, or PAI-1VN−. A: Fibroblasts were infected with three concentrations of adenoviruses, 30, 100, or 300 moi for 24 hours in 0.1% ITS+ before culturing for 6 days in 3% FBS. The activity of PAI-1 protein from culture media was analyzed using Spectrolyze (pL) PAI-1 assay (American Diagnostica). Tubulin levels in the cell layer were determined by Western blotting and image analysis and used to normalize the data for protease inhibition. n = 3; mean ± SD. B: Phase contrast images from cultures described above. Note morphological similarity, except for cells infected with Ad-PAI-1VN−, which display some cell rounding. Scale bar = 15 μm.
None
None
None

References

    1. Ehrlich HP, Desmouliere A, Diegelmann RF, Cohen IK, Compton CC, Garner WL, Kapanci Y, Gabbiani G. Morphological and immunochemical differences between keloid and hypertrophic scar. Am J Pathol. 1994;145:105–113. - PMC - PubMed
    1. Tuan TL, Nichter LS. The molecular basis of keloid and hypertrophic scar formation. Mol Med Today. 1998;4:19–24. - PubMed
    1. Al-Attar A, Mess S, Thomassen JM, Kauffman CL, Davison SP. Keloid pathogenesis and treatment. Plast Reconstr Surg. 2006;117:286–300. - PubMed
    1. Marneros AG, Norris JE, Watanabe S, Reichenberger E, Olsen BR. Genome scans provide evidence for keloid susceptibility loci on chromosomes 2q23 and 7p11. J Invest Dermatol. 2004;122:1126–1132. - PubMed
    1. Uitto J, Perejda AJ, Abergel RP, Chu ML, Ramirez F. Altered steady-state ratio of type I/III procollagen mRNAs correlates with selectively increased type I procollagen biosynthesis in cultured keloid fibroblasts. Proc Natl Acad Sci USA. 1985;82:5935–5939. - PMC - PubMed

Publication types

MeSH terms