. 2008 Nov 7;103(10):1109-19.
doi: 10.1161/CIRCRESAHA.108.185611. Epub 2008 Oct 2.

Ca2+ influx through T- and L-type Ca2+ channels have different effects on myocyte contractility and induce unique cardiac phenotypes

Affiliations

Ca2+ influx through T- and L-type Ca2+ channels have different effects on myocyte contractility and induce unique cardiac phenotypes

Naser Jaleel et al. Circ Res. .

Abstract

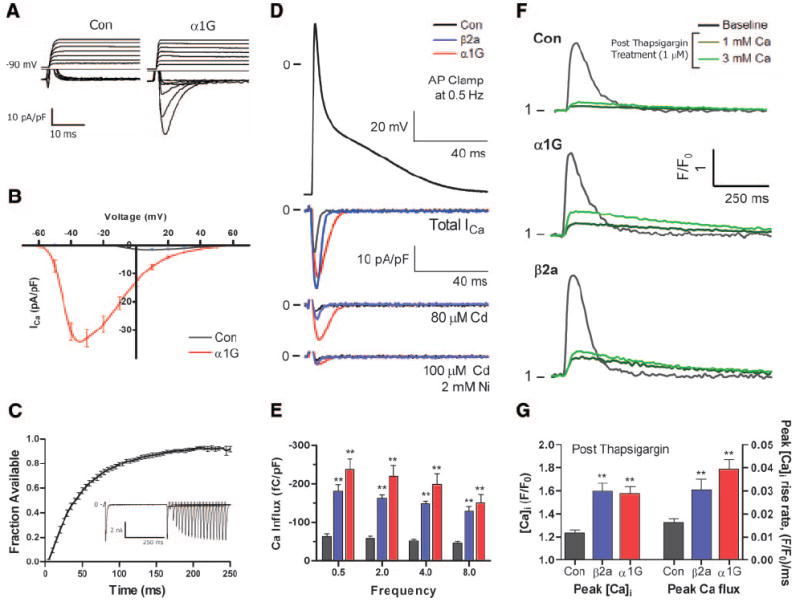
T-type Ca(2+) channels (TTCCs) are expressed in the developing heart, are not present in the adult ventricle, and are reexpressed in cardiac diseases involving cardiac dysfunction and premature, arrhythmogenic death. The goal of this study was to determine the functional role of increased Ca(2+) influx through reexpressed TTCCs in the adult heart. A mouse line with cardiac-specific, conditional expression of the alpha1G-TTCC was used to increase Ca(2+) influx through TTCCs. alpha1G hearts had mild increases in contractility but no cardiac histopathology or premature death. This contrasts with the pathological phenotype of a previously studied mouse with increased Ca(2+) influx through the L-type Ca(2+) channel (LTCC) secondary to overexpression of its beta2a subunit. Although alpha1G and beta2a myocytes had similar increases in Ca(2+) influx, alpha1G myocytes had smaller increases in contraction magnitude, and, unlike beta2a myocytes, there were no increases in sarcoplasmic reticulum Ca(2+) loading. Ca(2+) influx through TTCCs also did not induce normal sarcoplasmic reticulum Ca(2+) release. alpha1G myocytes had changes in LTCC, SERCA2a, and phospholamban abundance, which appear to be adaptations that help maintain Ca(2+) homeostasis. Immunostaining suggested that the majority of alpha1G-TTCCs were on the surface membrane. Osmotic shock, which selectively eliminates T-tubules, induced a greater reduction in L- versus TTCC currents. These studies suggest that T- and LTCCs are in different portions of the sarcolemma (surface membrane versus T-tubules) and that Ca(2+) influx through these channels induce different effects on myocyte contractility and lead to distinct cardiac phenotypes.


Figures

Figure 1
Figure 1. Properties of mice with α1G-TTCC overexpression
A, Schematic of the bitransgenic system for cardiac-specific α1G overexpression. tTA is the tetracycline-controlled transactivator system. B, Histology of α1G mice was not different than control. C, Representative M-mode echo recording in control and α1G mice. D, Fractional shortening (FS) and ejection fraction (EF) were greater in α1G vs control mice at comparable heart rates. *P<0.05.
Figure 2
Figure 2. Ca2+ influx in α1G and β2α myocytes
A, Representative ICa,T (ICa,L from −50 mV holding potential was subtracted from total Ca2+ current recorded from −90 mV holding potential) in control and α1G VMs. B, Voltage–current relationship of ICa,T (subtraction as in A) in control (n=10) and α1G (n=15) myocytes. C, Time course of ICa,T recovery from inactivation (n=7) and representative example of ICa,T recovery from inactivation (inset). D, Representative example of total Ca2+ currents under AP voltage clamp in control, β2a, and α1G VMs at 0.5 Hz. E, Integral of total Ca2+ current (without drugs) at different pacing frequencies in control (n=6), β2a (n=8), and α1G VMs (n=6). F, Representative example of [Ca2+]i transients at baseline and after thapsigargin application (1 μmol/L) at 1 mmol/L and 3 mmol/L bath Ca2+. G, Peak [Ca2+]i transient and rise rate of the [Ca2+]i transient after thapsigargin treatment (in 3 mmol/L Ca) in control (n=20), β2a (n=20), and α1G VMs (n=25).
Figure 3
Figure 3. ICa,L density in control, α1G, and β2a VMs
A, Representative examples of ICa,L in control, α1G, and β2a VMs. B and C, Voltage–current relationships (B) and peak ICa,L (C) in control (n=11), α1G (n=15), and β2a VMs (n=10). D and E, Voltage dependence of ICa,L activation (D) and average half-activation potential (V0.5) (E) in control (n=11), α1G (n=15), and β2a VMs (n=8). *P<0.05, **P<0.01.
Figure 4
Figure 4. APs, contractions, and cytosolic [Ca2+]i transients are altered in α1G VMs
A, Representative example of APs in control and α1G VMs. B, Average AP durations (APDs) at 50%, 70%, and 90% repolarization in control (n=9) and α1G (n=11) VMs. C and E, Representative example of [Ca2+]i transients (C) and contractions (E) from control, β2a, and α1G VMs. D, Peak [Ca2+]i transients and ô (Tau) of control (n=10), β2a (n=19), and α1G VMs (n=17). F, Average fractional shortening (FS) in control (n=10), β2a (n=19), and α1G VMs (n=17). *P<0.05, **P<0.01. See text for discussion.
Figure 5
Figure 5. SR Ca2+ content and NCX current are increased in β2a but not in α1G VMs
A, Representative example of caffeine-induced [Ca2+]i transients in control, β2a, and α1G VMs. B, Average data of peak caffeine-induced [Ca2+]i transients and ô of decay in control (n=15), β2a (n=13), and α1G VMs (n=17). C, Representative example of INCX from control and α1G VMs. D, Peak INCX at +60 mV and −80 mV in control (n=16) and α1G VMs (n=17).
Figure 6
Figure 6. Western blot analysis of Ca2+ regulatory proteins in control and α1G hearts
A, Representative Western blots of Ca2+ regulatory proteins from control (n=7) and α1G (n=6) hearts. B, Analysis of Ca2+ regulatory protein abundance normalized to GAPDH. RyR and PLB phosphorylation levels normalized to total RyR and PLB, respectively. R.U. indicates relative units. *P<0.05, **P<0.01.
Figure 7
Figure 7. ICa,T is less effective than ICa,L in inducing SR Ca2+ release (n=10)
A, Representative example of peak ICa,L and ICa,T and their corresponding [Ca2+]i transients and contractions. B, Average ICa,L (at + 10 mV) and ICa,T (at −40 mV), as measured in 1 mmol/L bath Ca2+. C and D, Peak [Ca2+]i transients (C) and peak contractions (D) triggered by ICa,L and ICa,T. E, EC coupling gain, determined as the ratio of peak [Ca2+]i transients/peak current for ICa,L and ICa,T. F, Maximum rate of rise of the [Ca2+]i transient induced by ICa,L and ICa,T. G, Maximum rate of contraction attributable to ICa,L and ICa,T. **P<0.01.
Figure 8
Figure 8. TTCC localization to surface sarcolemma away from the junctional SR
A, TTCC staining pattern (red) in α1G VMs at the level of the nucleus (blue) using an α1G-specific antibody. B, Background α1G staining pattern (red) in control VMs. C, LTCC staining pattern (red) using an α1C-specific antibody. D, RyR staining pattern using a RyR2-specific antibody. E and F, Membrane staining with di-8-ANEPPS (green) showing extensive T-tubular system in normal α1G VMs (E) and lack of T-tubules in detubulated α1G VMs (F) at the level of the nucleus (blue). G, Representative example of peak ICa,L and ICa,T in detubulated α1G VMs. H, Comparison of peak ICa,L and ICa,T before (n=15) and after (n=7) detubulation in α1G VMs. **P<0.01.

References

    1. Bers DM. Cardiac excitation-contraction coupling. Nature. 2002;415:198–205. - PubMed
    1. Bers DM, Perez-Reyes E. Ca channels in cardiac myocytes: structure and function in Ca influx and intracellular Ca release. Cardiovasc Res. 1999;42:339–360. - PubMed
    1. Berridge MJ, Lipp P, Bootman MD. The versatility and universality of calcium signalling. Nat Rev Mol Cell Biol. 2000;1:11–21. - PubMed
    1. Frey N, McKinsey TA, Olson EN. Decoding calcium signals involved in cardiac growth and function. Nat Med. 2000;6:1221–1227. - PubMed
    1. Maack C, O’Rourke B. Excitation-contraction coupling and mitochondrial energetics. Basic Res Cardiol. 2007;102:369–392. - PMC - PubMed

Publication types

MeSH terms

Substances