Review
. 2008 Nov;47(11):1233-51.
doi: 10.1097/CHI.0b013e318185e703.

Neuroimaging studies of normal brain development and their relevance for understanding childhood neuropsychiatric disorders

Affiliations
Review

Neuroimaging studies of normal brain development and their relevance for understanding childhood neuropsychiatric disorders

Rachel Marsh et al. J Am Acad Child Adolesc Psychiatry. 2008 Nov.

Abstract

Objective: To review the maturational events that occur during prenatal and postnatal brain development and to present neuroimaging findings from studies of healthy individuals that identify the trajectories of normal brain development.

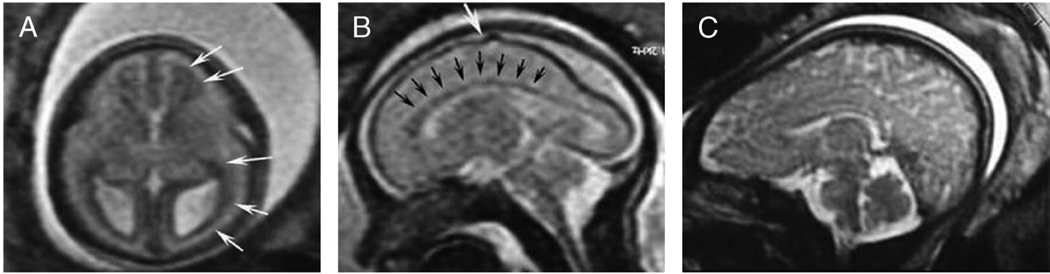
Method: Histological and postmortem findings of early brain development are presented, followed by a discussion of anatomical, diffusion tensor, proton spectroscopy, and functional imaging findings from studies of healthy individuals, with special emphasis on longitudinal data.

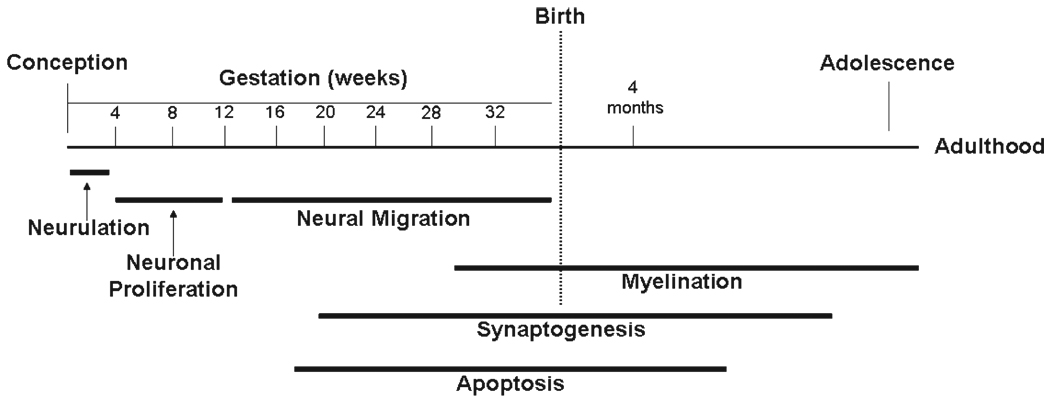
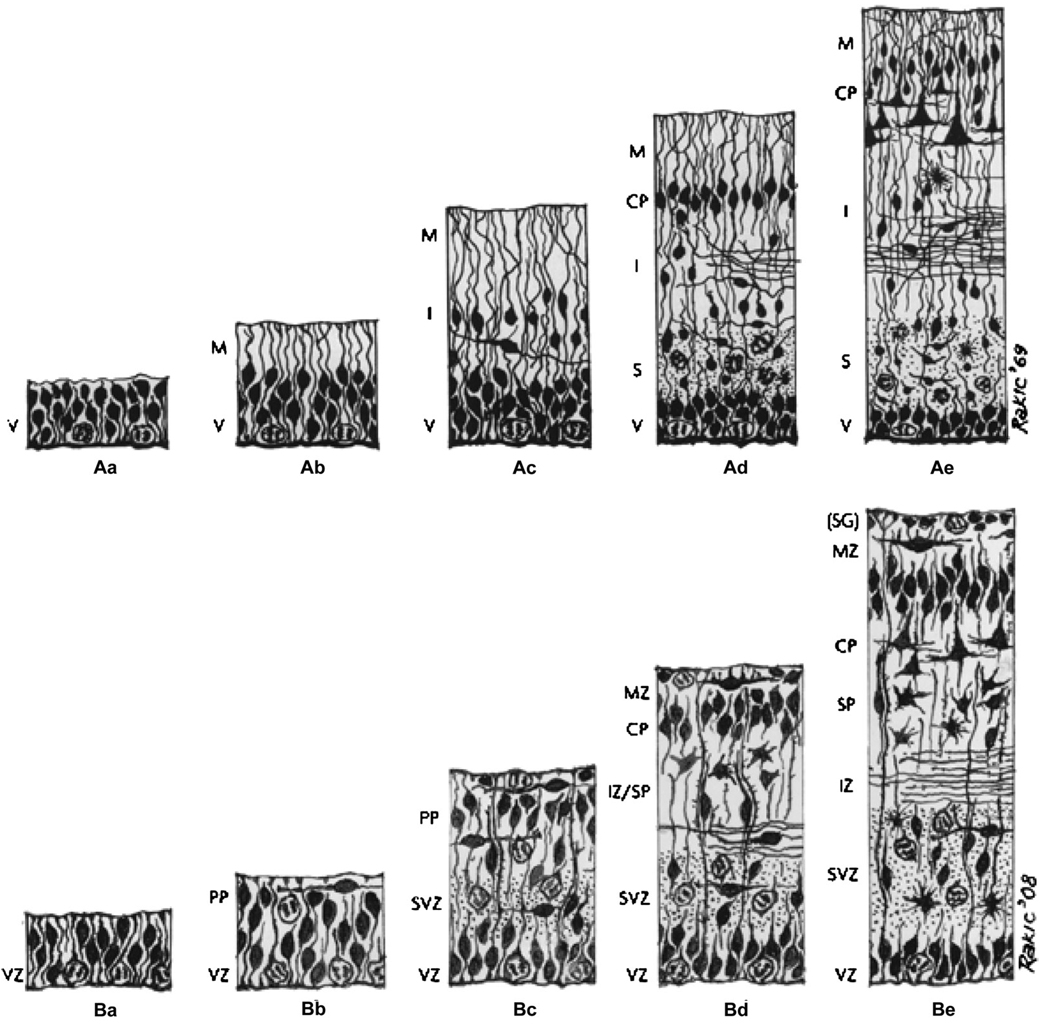
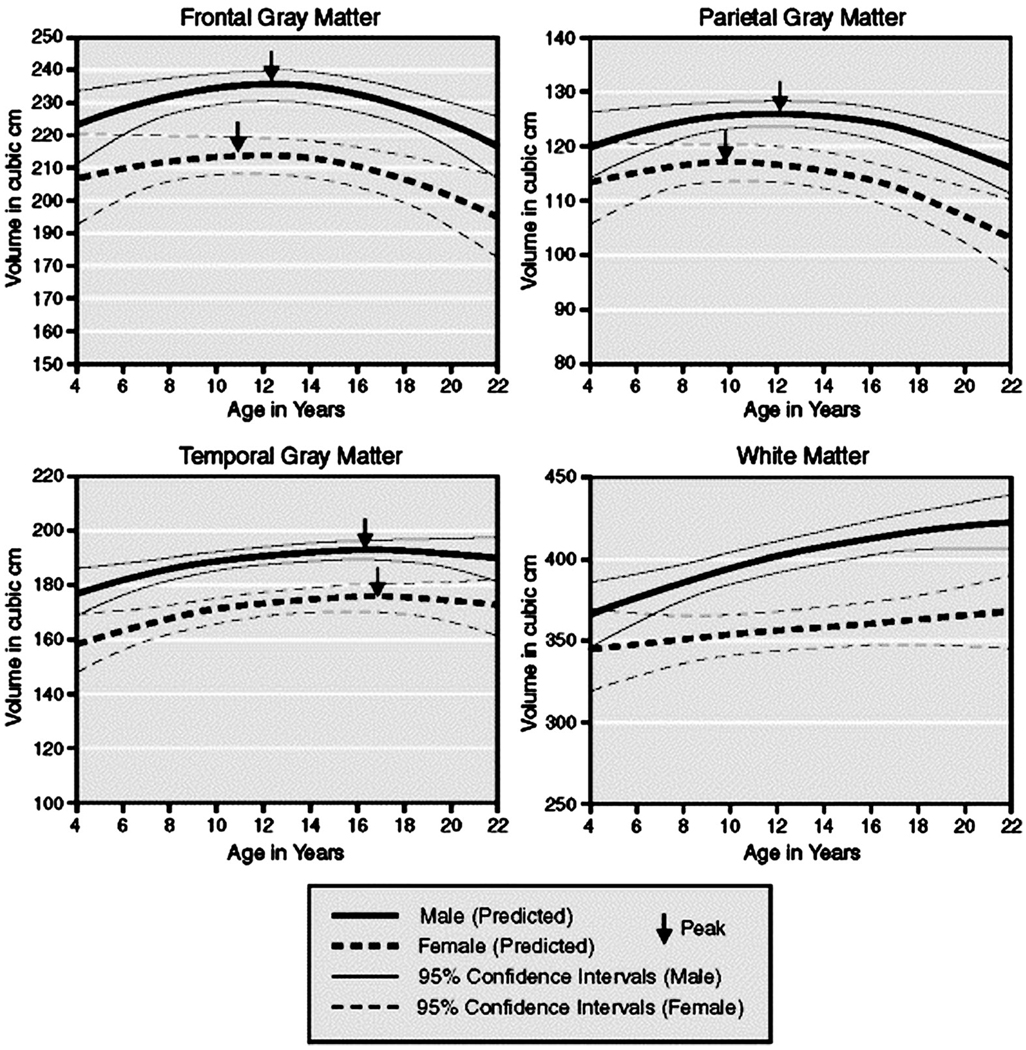
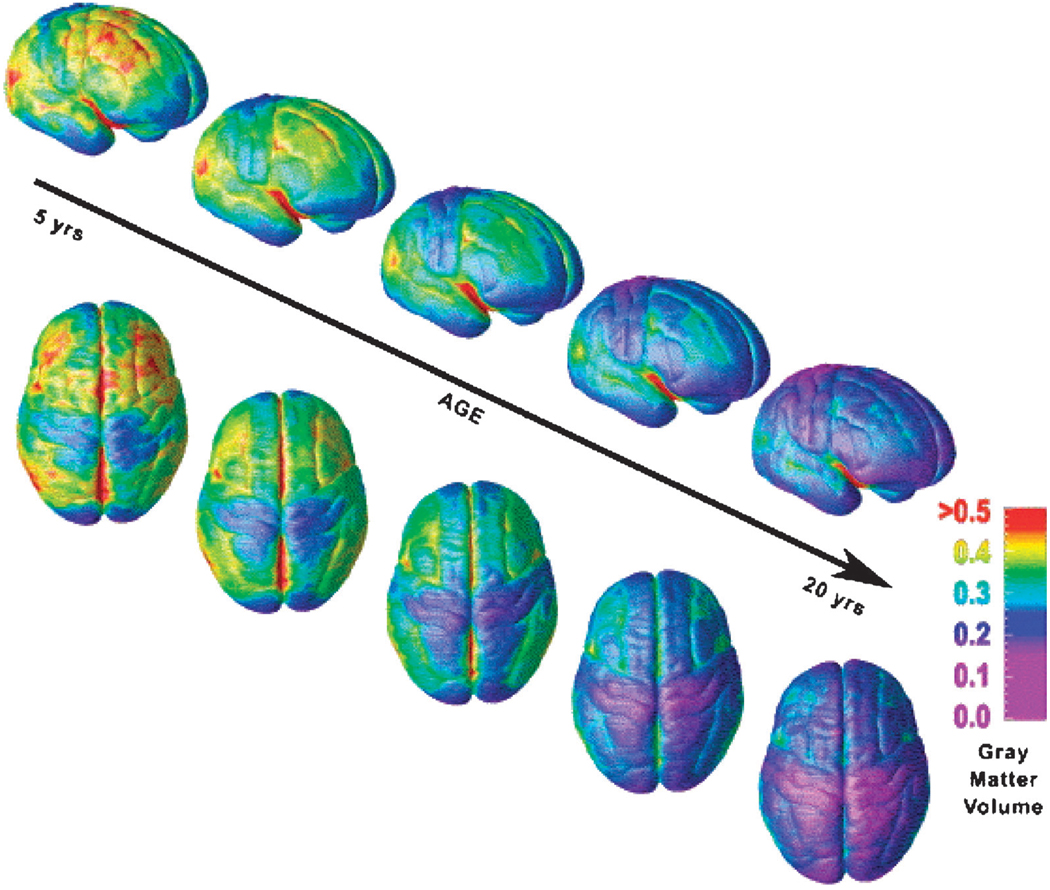
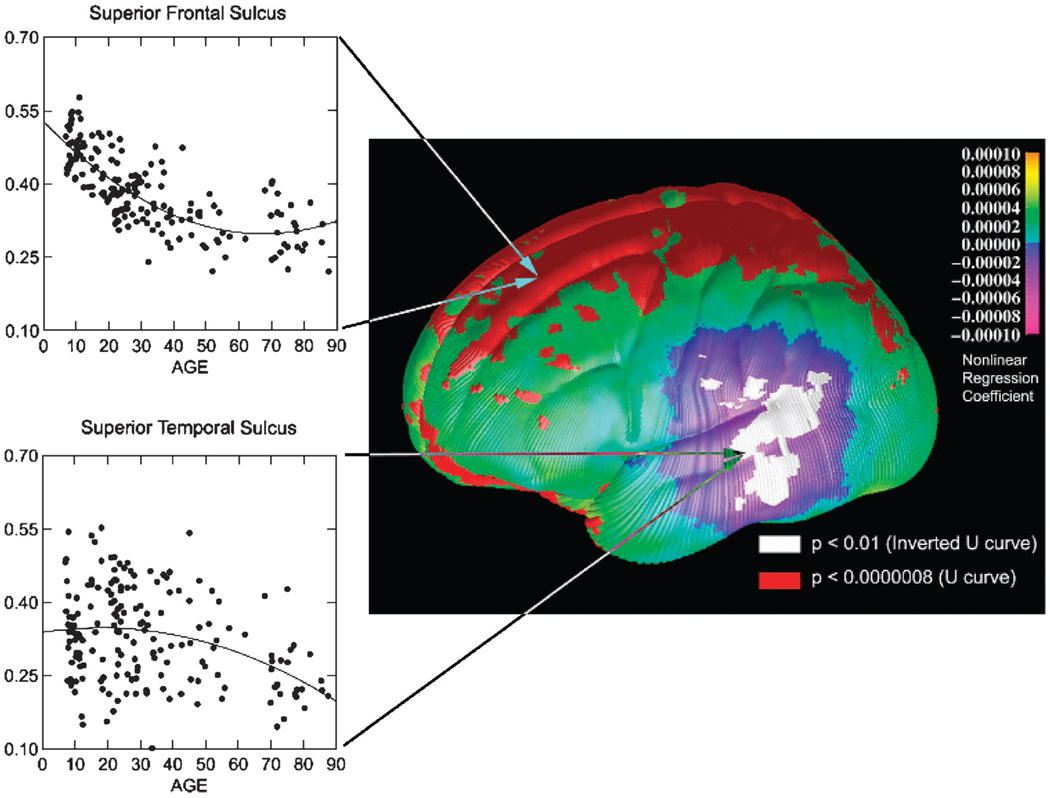
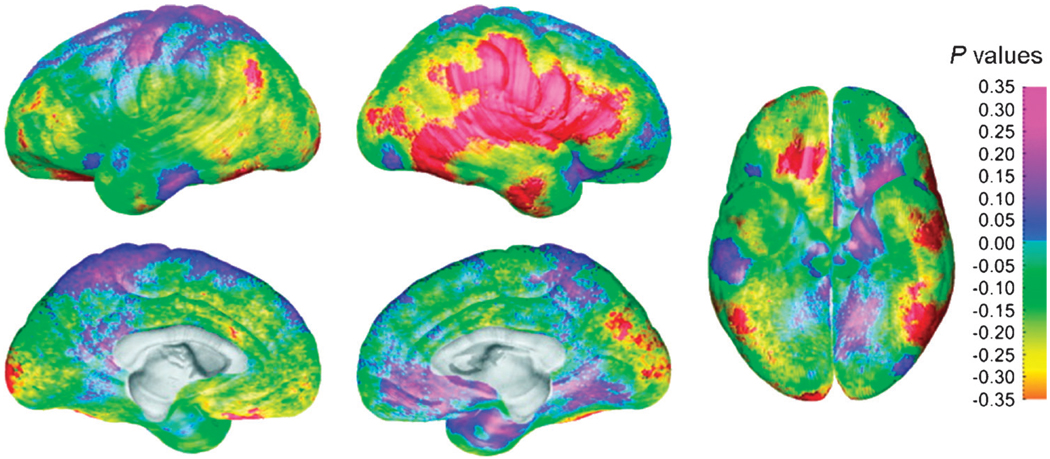
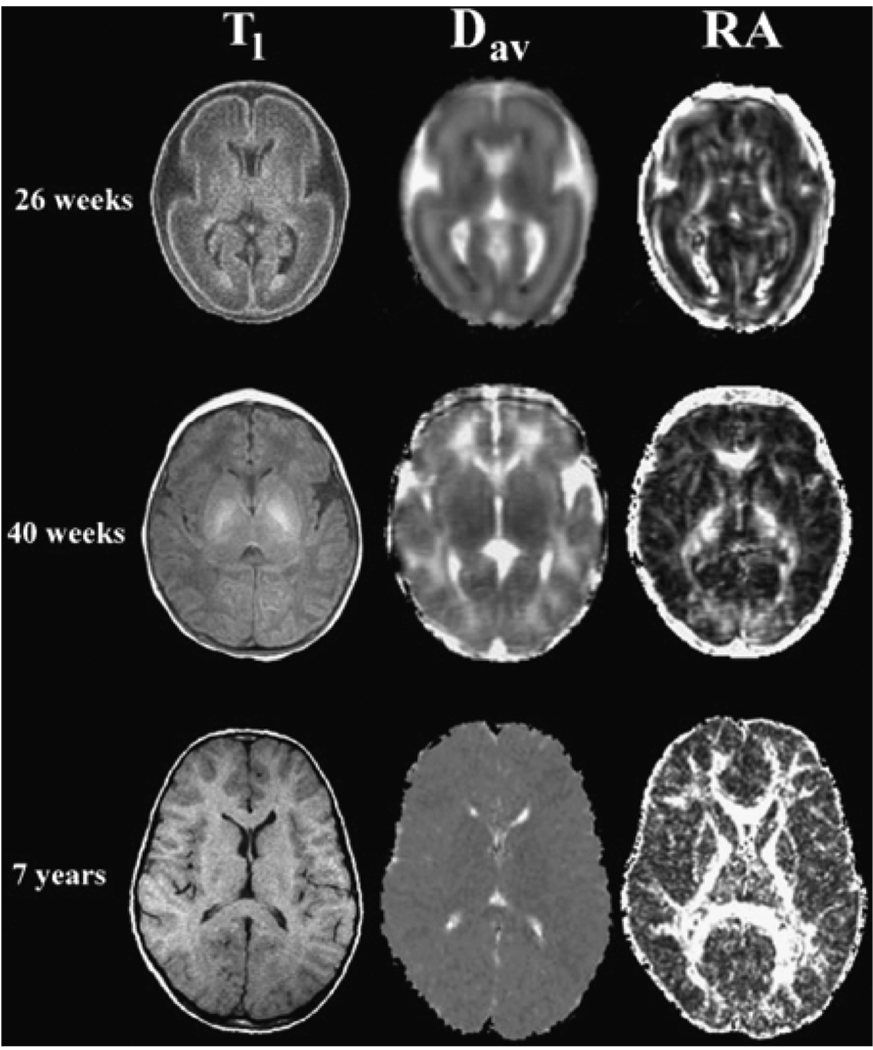
Results: Early brain development occurs through a sequence of major events, beginning with the formation of the neural tube and ending with myelination. Brain development at a macroscopic level typically proceeds first in sensorimotor areas, spreading subsequently and progressively into dorsal and parietal, superior temporal, and dorsolateral prefrontal cortices throughout later childhood and adolescence. These patterns of anatomical development parallel increasing activity in frontal cortices that subserves the development of higher-order cognitive functions during late childhood and adolescence. Disturbances in these developmental patterns seem to be involved centrally in the pathogenesis of various childhood psychiatric disorders including childhood-onset schizophrenia, attention-deficit/hyperactivity disorder, developmental dyslexia, Tourette's syndrome, and bipolar disorder.

Conclusions: Advances in imaging techniques have enhanced our understanding of normal developmental trajectories in the brain, which may improve insight into the abnormal patterns of development in various childhood psychiatric disorders.


Figures

Fig. 1
Fig. 1
Major events during brain development. Brain development proceeds in a sequence that begins with neurulation, followed by neuronal proliferation, neural migration, and apoptosis. The sequence ends with synaptogenesis and myelination, which continue into adulthood. Reprinted with permission from the American Journal of Psychiatry (Copyright 1999), American Psychiatric Association.
Fig. 2
Fig. 2
The Boulder Committee’s original 1970 model of human neocortical development and a 2008 revision. A, The Boulder Committee’s original summary diagram of neocortical development. B, A revised version published by Bystron et al in 2008. The figure depicts the sequence of developmental events at (a) embryonic day (E) 30, (b) E31–32, (c) E45, (d) E55. V/VZ = ventricular zone; M/MZ = marginal zone; I/IZ = intermediate zone; CP = cortical plate; S = subplate; PP = preplate; SVZ = subventricular zone; SG = subpial granular layer (part of the MZ). Reprinted with permission from Nature Publishing Group Macmillan Publishers Ltd.
Fig. 3
Fig. 3
Fetus development during gestation and at full-term. A, At 17 weeks of gestation, a wide T2-hypointense band along the ventricles corresponds to the germinal matrix (white arrows). The brain is agyric. B, At 23 weeks of gestation, the germinal matrix is thinned (black arrows), and the first indentation of the cerebral sulcus is visible (white arrow). C, At full term, maximal infolding of the brain surface occurs and myelination advances.
Fig. 4
Fig. 4
Growth curves of gray and white matter volumes. Shown here is the predicted size with 95% confidence intervals for cortical gray matter in frontal, parietal, and temporal lobes. The arrows indicate the reported peak volumes in males and females from a study that included 243 scans from 89 males and 56 females, aged 4 to 22 years. Reprinted with permission from Nature Publishing Group, Macmillan Publishers Ltd.
Fig. 5
Fig. 5
Right lateral and dorsal views of the dynamic sequence of gray matter maturation over the cortical surface of the brain. This sequence was constructed from 52 MRI scans from 13 subjects who were scanned every 2 years during a 10-year period from ages 4 to 21 years. Red indicates more gray matter; blue, less gray matter. Gray matter wanes in a back-to-front wave as the brain matures and neural connections are pruned. Sensorimotor areas that subserve more basic functions mature earlier, whereas superior temporal and dorsolateral prefrontal areas that subserve higher-order functions mature later. MRI = magnetic resonance imaging. Reprinted with permission from the National Academy of Sciences.
Fig. 6
Fig. 6
Age effects on gray matter density on the lateral brain surface between childhood and old age. Shades of green/yellow represent positive partial regression coefficients for the quadratic term (U-shaped curves with respect to age), and shades of blue/purple represent negative coefficients (inverted U-shaped curves). Regions in red correspond to regression coefficients that showed significant positive nonlinear age effects, and regions in white showed significant negative nonlinear age effects. Scatterplots of age effects with the best-fitting quadratic regression line are shown for sample surface points in the superior frontal sulcus (top) and the superior temporal sulcus (bottom) representative of the positive (U-shaped) and negative (inverted U-shaped) nonlinear age effects. Gray matter thinning over dorsal frontal and parietal cortices occurs rapidly during adolescence until age 45 years, whereas progressive thinning in posterior temporal cortices begins around age 45 years. Reprinted with permission from Nature Publishing Group, Macmillan Publishers Ltd.
Fig. 7
Fig. 7
Sex differences in gray matter thickness for a subgroup of 36 age- and brain volume–matched subjects. The significance of statistical differences in gray) matter thickness between the male and female subjects is shown according to the color bar on the right (Pearson correlation coefficients). Regions overlaid in red correspond to correlation coefficients that show significant increase in gray matter thickness in the female subjects at a threshold of p= .05. There were no regions where the male subjects had thicker cortex than the females at a threshold of p= .05. Thicker cortices in temporoparietal regions in females relative to males were independent of age and brain size. Reprinted with permission from Oxford University Press.
Fig. 8
Fig. 8
The average apparent diffusion and the relative anisotropy (RA) for healthy subjects of differing ages. These are axial slices at the level of the basal ganglia. The top row is from a premature infant of 26 weeks’ GA. The middle row is from a term infant of 40 weeks’ GA, and the bottom row is from a 7-year-old child. The left column consists of T1-weighted images for anatomical reference. The center column consists of Dav parametric maps for which higher diffusion values appear brighter. The right column consists of RA parametric maps for which higher RA values appear brighter. In healthy children, diffusion decreases, and the directional restriction of water diffusion increases, with advancing age. Dav = average apparent diffusion; RA = relative anisotropy; GA = gestational age. NMR Biomed, Neil J, Miller J, Mukherjee P, Huppi PS. Diffusion tensor imaging of normal and injured developing human brain Va technical review. Copyright © 2002. John Wiley & Sons Limited. Reproduced with permission.
Fig. 9
Fig. 9
Age correlates of cognitive control during performance of the Stroop task. A, Voxelwise correlations of age with Stroop activations. These are transaxial slices positioned superiorly to inferiorly (left to right). B, Group composite t-maps for the percent fMRI signal change associated with the naming of colors in incongruent compared with congruent stimuli for children and adults. Increases in signal during the incongruent relative to congruent are coded in yellow, and decreases are coded in purple or blue. Right frontostriatal (ILPFC and Lent) increases in activity associated with incongruent stimuli came online progressively with age. Thus, increasing activity in frontostriatal circuits with age supports the developmental improvements in cognitive control in healthy individuals. PCC = posterior cingulate cortex; ACC = anterior cingulate cortex; VACC = ventral anterior cingulate cortex; STG = superior temporal gyrus; Lnuc = lenticular nucleus; LPFC = lateral prefrontal cortex; MPFC = mesial prefrontal cortex; IFG = inferior frontal gyrus.

Similar articles

Cited by

References

    1. Huttenlocher PR, Dabholkar AS. Regional differences in synaptogenesis in human cerebral cortex. J Comp Neurol. 1997;387(2):167–178. - PubMed
    1. Levitt P. Structural and functional maturation of the developing primate brain. J Pediatr. 2003;l43(suppl 4):S35–S45. - PubMed
    1. Black IB, DiCicco-Bloom E, Dreyfus CF. Nerve growth factor and the issue of mitosis in the nervous system. Curr Top Dev Biol. 1990;24:161–192. - PubMed
    1. Giedd J. Brain development, IX: human brain growth. Am J Psychiatry. 1999;156(1):4. - PubMed
    1. Molliver ME, Kostovic I, van der Loos H. The development of synapses in cerebral cortex of the human fetus. Brain Res. 1973;50(2):403–407. - PubMed

Publication types

MeSH terms