Epstein-Barr nuclear antigen 1 contributes to nasopharyngeal carcinoma through disruption of PML nuclear bodies
- PMID: 18833293
- PMCID: PMC2542412
- DOI: 10.1371/journal.ppat.1000170
Epstein-Barr nuclear antigen 1 contributes to nasopharyngeal carcinoma through disruption of PML nuclear bodies
Abstract
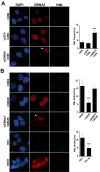
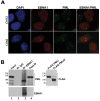
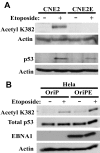
Latent Epstein-Barr virus (EBV) infection is strongly associated with several cancers, including nasopharyngeal carcinoma (NPC), a tumor that is endemic in several parts of the world. We have investigated the molecular basis for how EBV latent infection promotes the development of NPC. We show that the viral EBNA1 protein, previously known to be required to maintain the EBV episomes, also causes the disruption of the cellular PML (promyelocytic leukemia) nuclear bodies (or ND10s). This disruption occurs both in the context of a native latent infection and when exogenously expressed in EBV-negative NPC cells and involves loss of the PML proteins. We also show that EBNA1 is partially localized to PML nuclear bodies in NPC cells and interacts with a specific PML isoform. PML disruption by EBNA1 requires binding to the cellular ubiquitin specific protease, USP7 or HAUSP, but is independent of p53. We further observed that p53 activation, DNA repair and apoptosis, all of which depend on PML nuclear bodies, were impaired by EBNA1 expression and that cells expressing EBNA1 were more likely to survive after induction of DNA damage. The results point to an important role for EBNA1 in the development of NPC, in which EBNA1-mediated disruption of PML nuclear bodies promotes the survival of cells with DNA damage.
Conflict of interest statement
The authors have declared that no competing interests exist.
Figures


Similar articles
-
Viral disruption of promyelocytic leukemia (PML) nuclear bodies by hijacking host PML regulators.Virulence. 2011 Jan-Feb;2(1):58-62. doi: 10.4161/viru.2.1.14610. Epub 2011 Jan 1. Virulence. 2011. PMID: 21217204
-
Contributions of the Epstein-Barr virus EBNA1 protein to gastric carcinoma.J Virol. 2012 Jan;86(1):60-8. doi: 10.1128/JVI.05623-11. Epub 2011 Oct 19. J Virol. 2012. PMID: 22013060 Free PMC article.
-
Epstein-Barr virus nuclear antigen 1 Hijacks the host kinase CK2 to disrupt PML nuclear bodies.J Virol. 2010 Nov;84(21):11113-23. doi: 10.1128/JVI.01183-10. Epub 2010 Aug 18. J Virol. 2010. PMID: 20719947 Free PMC article.
-
EBNA1.Curr Top Microbiol Immunol. 2015;391:3-34. doi: 10.1007/978-3-319-22834-1_1. Curr Top Microbiol Immunol. 2015. PMID: 26428370 Review.
-
Potential cellular functions of Epstein-Barr Nuclear Antigen 1 (EBNA1) of Epstein-Barr Virus.Viruses. 2013 Jan 16;5(1):226-40. doi: 10.3390/v5010226. Viruses. 2013. PMID: 23325328 Free PMC article. Review.
Cited by
-
TRIMming Type I Interferon-Mediated Innate Immune Response in Antiviral and Antitumor Defense.Viruses. 2021 Feb 11;13(2):279. doi: 10.3390/v13020279. Viruses. 2021. PMID: 33670221 Free PMC article. Review.
-
A survey of the interactome of Kaposi's sarcoma-associated herpesvirus ORF45 revealed its binding to viral ORF33 and cellular USP7, resulting in stabilization of ORF33 that is required for production of progeny viruses.J Virol. 2015 May;89(9):4918-31. doi: 10.1128/JVI.02925-14. Epub 2015 Feb 18. J Virol. 2015. PMID: 25694600 Free PMC article.
-
Promyelocytic leukemia protein modulates establishment and maintenance of latent gammaherpesvirus infection in peritoneal cells.J Virol. 2013 Nov;87(22):12151-7. doi: 10.1128/JVI.01696-13. Epub 2013 Aug 28. J Virol. 2013. PMID: 23986598 Free PMC article.
-
Murine gammaherpesvirus 68 ORF75c contains ubiquitin E3 ligase activity and requires PML SUMOylation but not other known cellular PML regulators, CK2 and E6AP, to mediate PML degradation.Virology. 2013 Jun 5;440(2):140-9. doi: 10.1016/j.virol.2013.02.014. Epub 2013 Mar 27. Virology. 2013. PMID: 23541081 Free PMC article.
-
Interplay between viruses and host sumoylation pathways.Nat Rev Microbiol. 2013 Jun;11(6):400-11. doi: 10.1038/nrmicro3015. Epub 2013 Apr 29. Nat Rev Microbiol. 2013. PMID: 23624814 Review.
References
-
- Raab-Traub N. Epstein-Barr virus in the pathogenesis of NPC. Semin Cancer Biol. 2002;12:431–441. - PubMed
-
- Seto E, Yang L, Middeldorp J, Sheen TS, Chen JY, et al. Epstein-Barr virus (EBV)-encoded BARF1 gene is expressed in nasopharyngeal carcinoma and EBV-associated gastric carcinoma tissues in the absence of lytic gene expression. J Med Virol. 2005;76:82–88. - PubMed
-
- Zheng H, Li LL, Hu DS, Deng XY, Cao Y. Role of Epstein-Barr virus encoded latent membrane protein 1 in the carcinogenesis of nasopharyngeal carcinoma. Cell Mol Immunol. 2007;4:185–196. - PubMed
-
- Sall A, Caserta S, Jolicoeur P, Franqueville L, de Turenne-Tessier M, et al. Mitogenic activity of Epstein-Barr virus-encoded BARF1 protein. Oncogene. 2004;23:4938–4944. - PubMed
Publication types
MeSH terms
Substances
LinkOut - more resources
Full Text Sources
Research Materials
Miscellaneous

