

Not proper ROC curves as new tool for the analysis of differentially expressed genes in microarray experiments
- PMID: 18834513
- PMCID: PMC2576270
- DOI: 10.1186/1471-2105-9-410
Not proper ROC curves as new tool for the analysis of differentially expressed genes in microarray experiments
Abstract
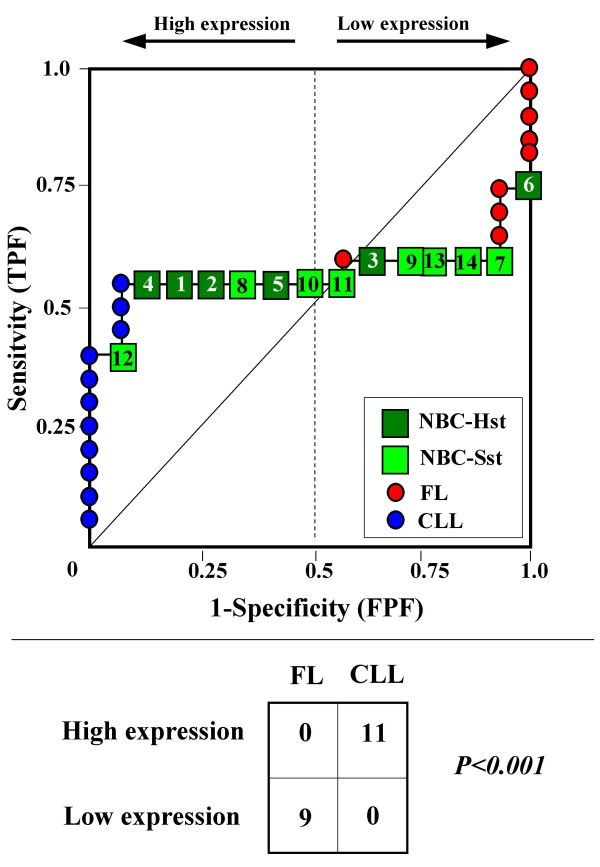
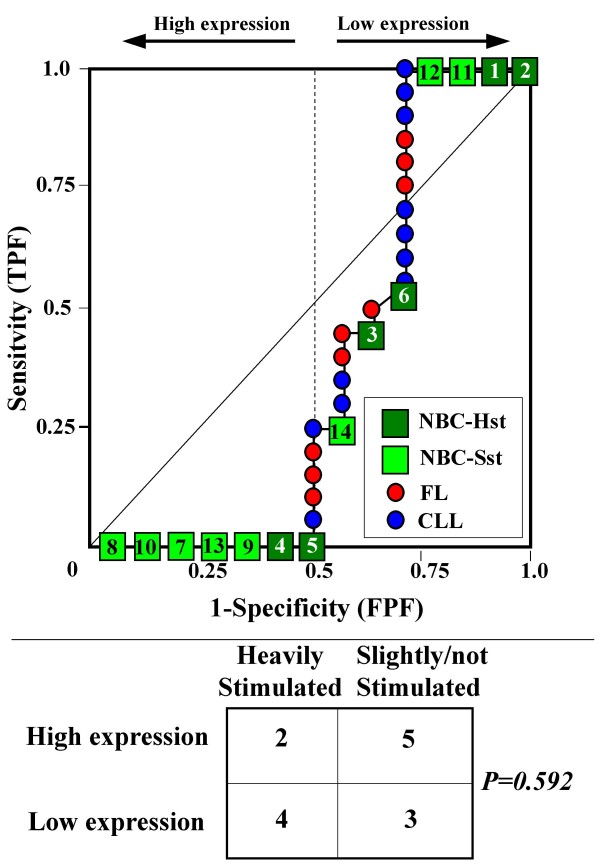
Most microarray experiments are carried out with the purpose of identifying genes whose expression varies in relation with specific conditions or in response to environmental stimuli. In such studies, genes showing similar mean expression values between two or more groups are considered as not differentially expressed, even if hidden subclasses with different expression values may exist. In this paper we propose a new method for identifying differentially expressed genes, based on the area between the ROC curve and the rising diagonal (ABCR). ABCR represents a more general approach than the standard area under the ROC curve (AUC), because it can identify both proper (i.e., concave) and not proper ROC curves (NPRC). In particular, NPRC may correspond to those genes that tend to escape standard selection methods.
Results: We assessed the performance of our method using data from a publicly available database of 4026 genes, including 14 normal B cell samples (NBC) and 20 heterogeneous lymphomas (namely: 9 follicular lymphomas and 11 chronic lymphocytic leukemias). Moreover, NBC also included two sub-classes, i.e., 6 heavily stimulated and 8 slightly or not stimulated samples. We identified 1607 differentially expressed genes with an estimated False Discovery Rate of 15%. Among them, 16 corresponded to NPRC and all escaped standard selection procedures based on AUC and t statistics. Moreover, a simple inspection to the shape of such plots allowed to identify the two subclasses in either one class in 13 cases (81%).
Conclusion: NPRC represent a new useful tool for the analysis of microarray data.
Figures


Similar articles
-
Arrow plot: a new graphical tool for selecting up and down regulated genes and genes differentially expressed on sample subgroups.BMC Bioinformatics. 2012 Jun 26;13:147. doi: 10.1186/1471-2105-13-147. BMC Bioinformatics. 2012. PMID: 22734592 Free PMC article.
-
A spline function approach for detecting differentially expressed genes in microarray data analysis.Bioinformatics. 2004 Nov 22;20(17):2954-63. doi: 10.1093/bioinformatics/bth339. Epub 2004 Jun 4. Bioinformatics. 2004. PMID: 15180936
-
Cross platform microarray analysis for robust identification of differentially expressed genes.BMC Bioinformatics. 2007 Mar 8;8 Suppl 1(Suppl 1):S5. doi: 10.1186/1471-2105-8-S1-S5. BMC Bioinformatics. 2007. PMID: 17430572 Free PMC article.
-
The use of genetic microarray analysis to classify and predict prognosis in haematological malignancies.Clin Lab Haematol. 2003 Aug;25(4):209-20. doi: 10.1046/j.1365-2257.2003.00532.x. Clin Lab Haematol. 2003. PMID: 12890159 Review.
-
Statistical issues in the design and analysis of gene expression microarray studies of animal models.J Mammary Gland Biol Neoplasia. 2003 Jul;8(3):359-74. doi: 10.1023/b:jomg.0000010035.57912.5a. J Mammary Gland Biol Neoplasia. 2003. PMID: 14973379 Review.
Cited by
-
Comprehensive genomic and immunophenotypic analysis of CD4 T cell infiltrating human triple-negative breast cancer.Cancer Immunol Immunother. 2021 Jun;70(6):1649-1665. doi: 10.1007/s00262-020-02807-1. Epub 2020 Dec 10. Cancer Immunol Immunother. 2021. PMID: 33301062 Free PMC article.
-
The clinical meaning of the area under a receiver operating characteristic curve for the evaluation of the performance of disease markers.Epidemiol Health. 2022;44:e2022088. doi: 10.4178/epih.e2022088. Epub 2022 Oct 17. Epidemiol Health. 2022. PMID: 36265519 Free PMC article.
-
An Ensemble Feature Selection Method for Biomarker Discovery.Proc IEEE Int Symp Signal Proc Inf Tech. 2017 Dec;2017:416-421. doi: 10.1109/ISSPIT.2017.8388679. Epub 2018 Jun 21. Proc IEEE Int Symp Signal Proc Inf Tech. 2017. PMID: 30887013 Free PMC article.
-
Prognostic signatures associated with high infiltration of Tregs in bone metastatic prostate cancer.Aging (Albany NY). 2021 Jul 6;13(13):17442-17461. doi: 10.18632/aging.203234. Epub 2021 Jul 6. Aging (Albany NY). 2021. PMID: 34229299 Free PMC article.
-
Area under the ROC Curve has the most consistent evaluation for binary classification.PLoS One. 2024 Dec 23;19(12):e0316019. doi: 10.1371/journal.pone.0316019. eCollection 2024. PLoS One. 2024. PMID: 39715186 Free PMC article.
References
-
- Dudoit S, Yang YH, Speed TP, Callow MJ. Statistical methods for identifying differentially expressed genes in replicated cDNA microarray experiments. Statistica Sinica. 2002;12:111–139.
-
- Pepe MS. The statistical evaluation of medical tests for classification and prediction. Oxford (UK): Oxford University Press; 2003.
Publication types
MeSH terms
Substances
LinkOut - more resources
Full Text Sources
Medical
