. 2008 Oct 6:5:24.
doi: 10.1186/1743-7075-5-24.

Body circumferences: clinical implications emerging from a new geometric model

Affiliations

Body circumferences: clinical implications emerging from a new geometric model

Steven B Heymsfield et al. Nutr Metab (Lond). .

Abstract

Background: Body volume expands with the positive energy balance associated with the development of adult human obesity and this "growth" is captured by two widely used clinical metrics, waist circumference and body mass index (BMI). Empirical correlations between circumferences, BMI, and related body compartments are frequently reported but fail to provide an important common conceptual foundation that can be related to key clinical observations. A two-phase program was designed to fill this important gap: a geometric model linking body volume with circumferences and BMI was developed and validated in cross-sectional cohorts; and the model was applied to the evaluation of longitudinally monitored subjects during periods of voluntary weight loss. Concepts emerging from the developed model were then used to examine the relations between the evaluated clinical measures and body composition.

Methods: Two groups of healthy adults (n = 494 and 1499) were included in the cross-sectional model development/testing phase and subjects in two previous weight loss studies were included in the longitudinal model evaluation phase. Five circumferences (arm, waist, hip, thigh, and calf; average of sum, C), height (H), BMI, body volume (V; underwater weighing), and the volumes of major body compartments (whole-body magnetic resonance imaging) were measured.

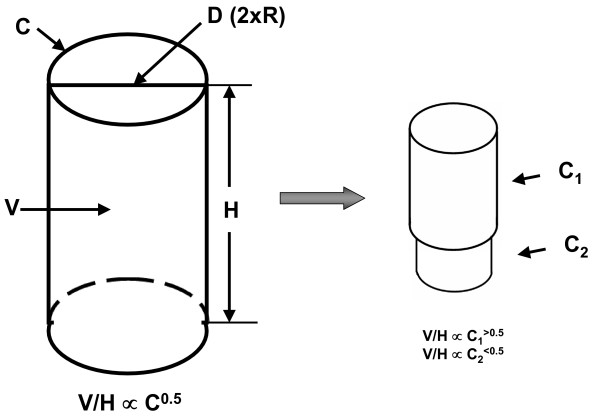
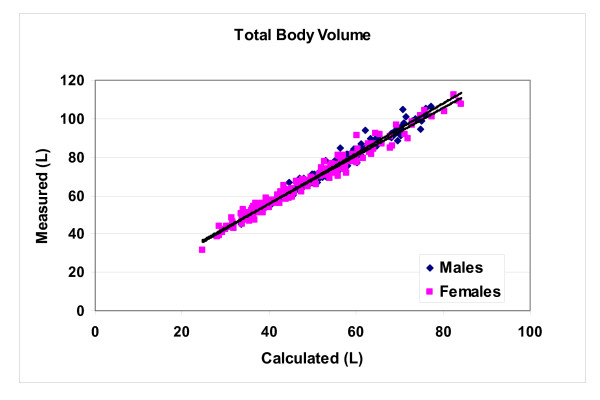
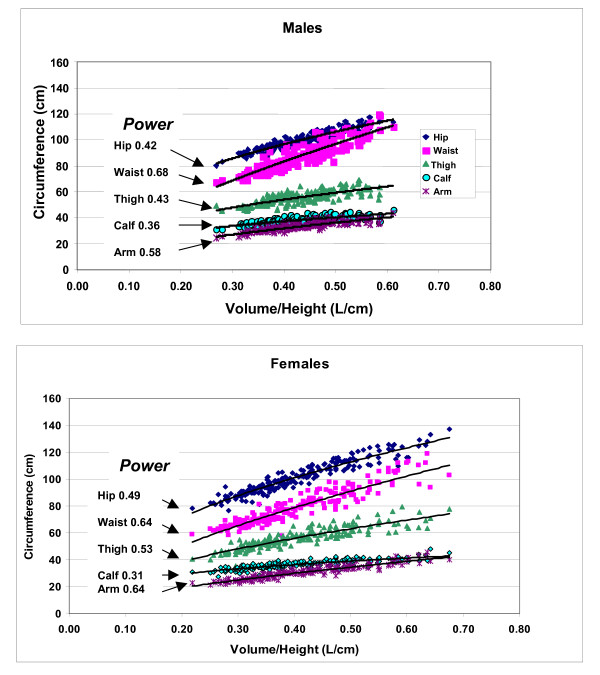
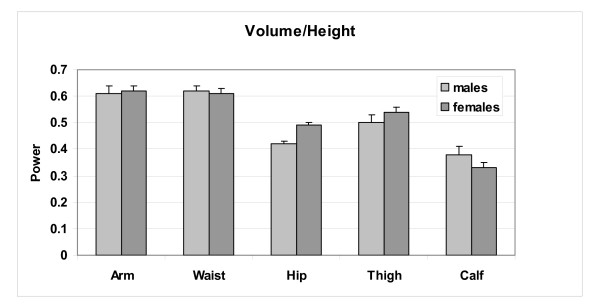
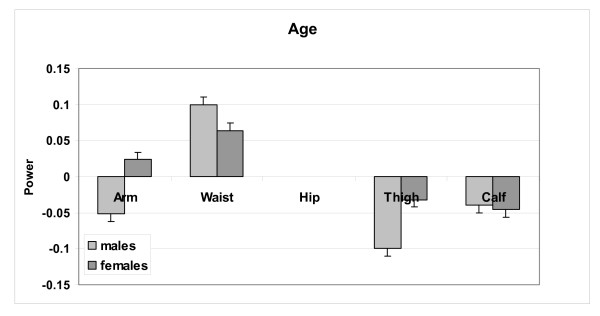
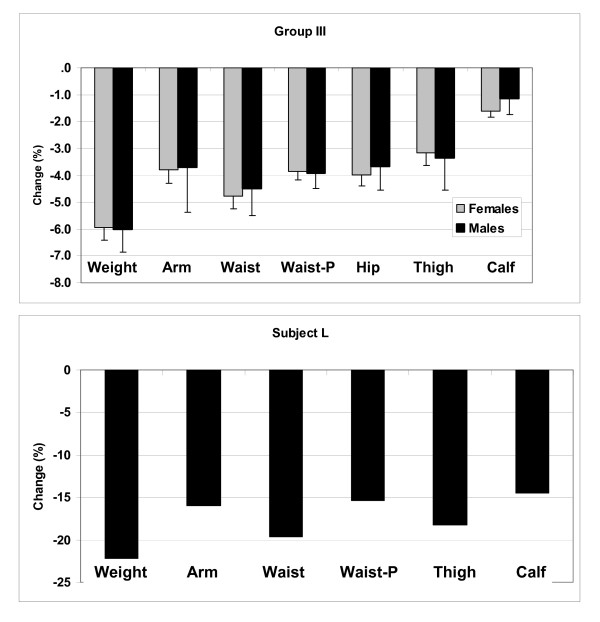
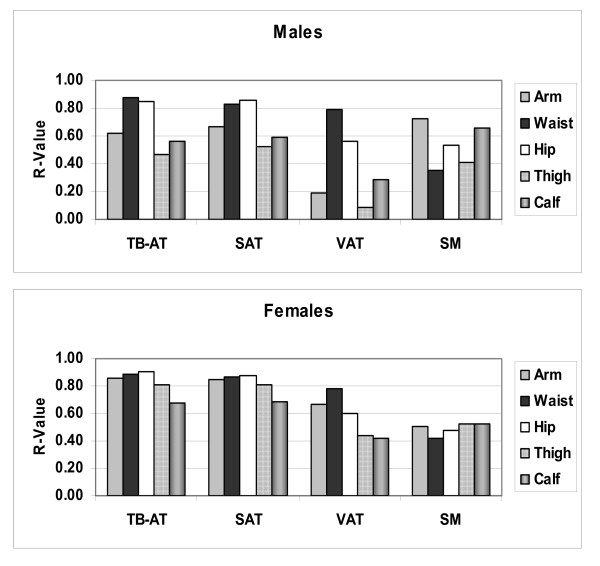
Results: The evaluation of a humanoid geometric model based a cylinder confirmed that V derived from C and H was highly correlated with measured V [R2 both males and females, 0.97; p < 0.001). Developed allometric models confirmed model predictions that C and BMI (represented as V/H) are directly linked as, C = (V/H)0.5. The scaling of individual circumferences to V/H varied, with waist the highest (V/H~0.6) and calf the lowest (V/H~0.3), indicating that the largest and smallest between-subject "growth" with greater body volume occurs in the abdominal area and lower extremities, respectively. A stepwise linear regression model including all five circumferences2 showed that each contributed independently to V/H. These cross-sectional observations were generally confirmed by analysis of the two longitudinal weight loss studies. The scaling of circumference ratios (e.g., waist/hip) to V/H conformed to models developed on the scaling of individual circumferences to V/H, indicating their relations to BMI are predictable a priori. Waist, hip, and arm/calf circumferences had the highest associations with whole-body visceral adipose tissue, subcutaneous adipose tissue, and skeletal muscle volumes, respectively.

Conclusion: These observations provide a simple geometric model relating circumferences with body size and composition, introduce a conceptual foundation explaining previous empirical observations, and reveal new clinical insights.


Figures

Figure 1
Figure 1
Basic cylinder model (left) and additional hypothetical model with body volume (V) expansion including two different cylinders placed in series (right). In the basic cylinder model and sphere, circumferences (C) as indicated in the figure are proportional (∝) to the square root of volume/height (V/H) (i.e., V/H0.5) and volume is proportional to the product of height and circumference squared. Cylinder 1 in the double cylinder model increases in volume more rapidly than cylinder 2 and this difference in the rate of expansion influences the scaling of total volume/height to the respective circumferences as indicated in the figure. Abbreviations: D, diameter; H, height; R, radius.
Figure 2
Figure 2
Body volume (L) measured by hydrodensitometry plotted against body volume calculated using the simple cylinder model presented in equation 1. The average of five measured circumferences represents C in equation 1. Males: Vmeasured = 1.30 × Vcalcluated+3.50; R2, 0.97; SEE 2.42) and females: Vmeasured = 1.25 × Vcalcluated+5.80; R2, 0.97; SEE 2.50).
Figure 3
Figure 3
Univariate allometric plots of circumferences versus volume/height for males (upper) and females (lower). The respective powers of volume/height are shown in the figure; all models were statistically significant at p < 0.05.
Figure 4
Figure 4
Power of volume/height (± SE) observed for each male and female multiple regression circumference prediction model presented in Table 2.
Figure 5
Figure 5
Power of age (± SE) observed for each male and female multiple regression circumference prediction model presented in Table 2. Age was not a significant predictor in the hip circumference prediction model.
Figure 6
Figure 6
Univariate plots of selected circumference ratios versus volume/height in males. All of the correlations are significant at p < 0.05.
Figure 7
Figure 7
Mean (± SE) percent change in body weight and circumferences in males and females participating in the Group III weight loss study (upper panel). Percentage change in weight and circumferences observed after 31 days of total starvation in Subject L. Abbreviation: P, predicted.
Figure 8
Figure 8
Correlation matrix of Group I study measures. Abbreviations: BMI, body mass index; Csum, sum of the 5 circumferences; SAT, VAT, TB-AT are subcutaneous, visceral, and total body adipose tissue volume; SM, skeletal muscle volume; W/H, weight to height ratio. N = 231 males and 263 females. All correlations r ≥ 0.20 are statistically significant at p < 0.05. Males comprise the lower half and females the upper half of the table as defined by the diagonal line. Shading represents grouping of measurement types (circumferences, body composition, and weight-stature).
Figure 9
Figure 9
Correlation coefficients (R-values) for simple linear regression analyses of five circumferences versus total body volumes of adipose tissue and skeletal muscle. Abbreviations: SAT, TB-AT, VAT, subcutaneous, total, and visceral adipose tissue, SM, skeletal muscle.
Figure 10
Figure 10
The potential utility of circumference measurements in providing surrogate estimates of body compartments. The body is segmented into cylinders with some including an associated circumference. The cylinder circumferences and volumes relate to body compartments with correlations ranging from low to high as indicated in the figure. The circumferences also scale to volume/height (V/H) with powers (β) of variable magnitude, reflecting their respective sensitivities to body "growth" as defined by between-subject differences. Abbreviations: BMI, body mass index; NA, not applicable; SAT, VAT, and TB-AT, subcutaneous, visceral and total body adipose tissue; SM, skeletal muscle.

References

    1. Heymsfield SB, Gallagher D, Mayer L, Beetsch J, Pietrobelli A. Scaling of Human Body Composition to Stature: New Insights into Body Mass Index, in press. Am J Clin Nutr. 2007;86:82–91. - PMC - PubMed
    1. Han TS, Seidell JC, Currall JE, Morrison CE, Deurenberg P, Lean ME. The influences of height and age on waist circumference as an index of adiposity in adults. Int J Obes Relat Metab Disord. 1997;21:83–9. doi: 10.1038/sj.ijo.0800371. - DOI - PubMed
    1. Kuk JL, Janiszewski PM, Ross R. Body mass index and hip and thigh circumferences are negatively associated with visceral adipose tissue after control for waist circumference. Am J Clin Nutr. 2007;85:1540–4. - PubMed
    1. Chan DC, Watts GF, Barrett PH, Burke V. Waist circumference, waist-to-hip ratio and body mass index as predictors of adipose tissue compartments in men. QJM. 2003;96:441–447. doi: 10.1093/qjmed/hcg069. - DOI - PubMed
    1. Abate N, Garg A, Peshock RM, Stray-Gundersen J, Grundy SM. Relationships of generalized and regional adiposity to insulin sensitivity in men. J Clin Invest. 1995;96:88–98. doi: 10.1172/JCI118083. - DOI - PMC - PubMed

LinkOut - more resources