. 2008 Oct 7;14(4):312-23.
doi: 10.1016/j.ccr.2008.09.001.

Impaired DNA damage response, genome instability, and tumorigenesis in SIRT1 mutant mice

Affiliations

Impaired DNA damage response, genome instability, and tumorigenesis in SIRT1 mutant mice

Rui-Hong Wang et al. Cancer Cell. .

Abstract

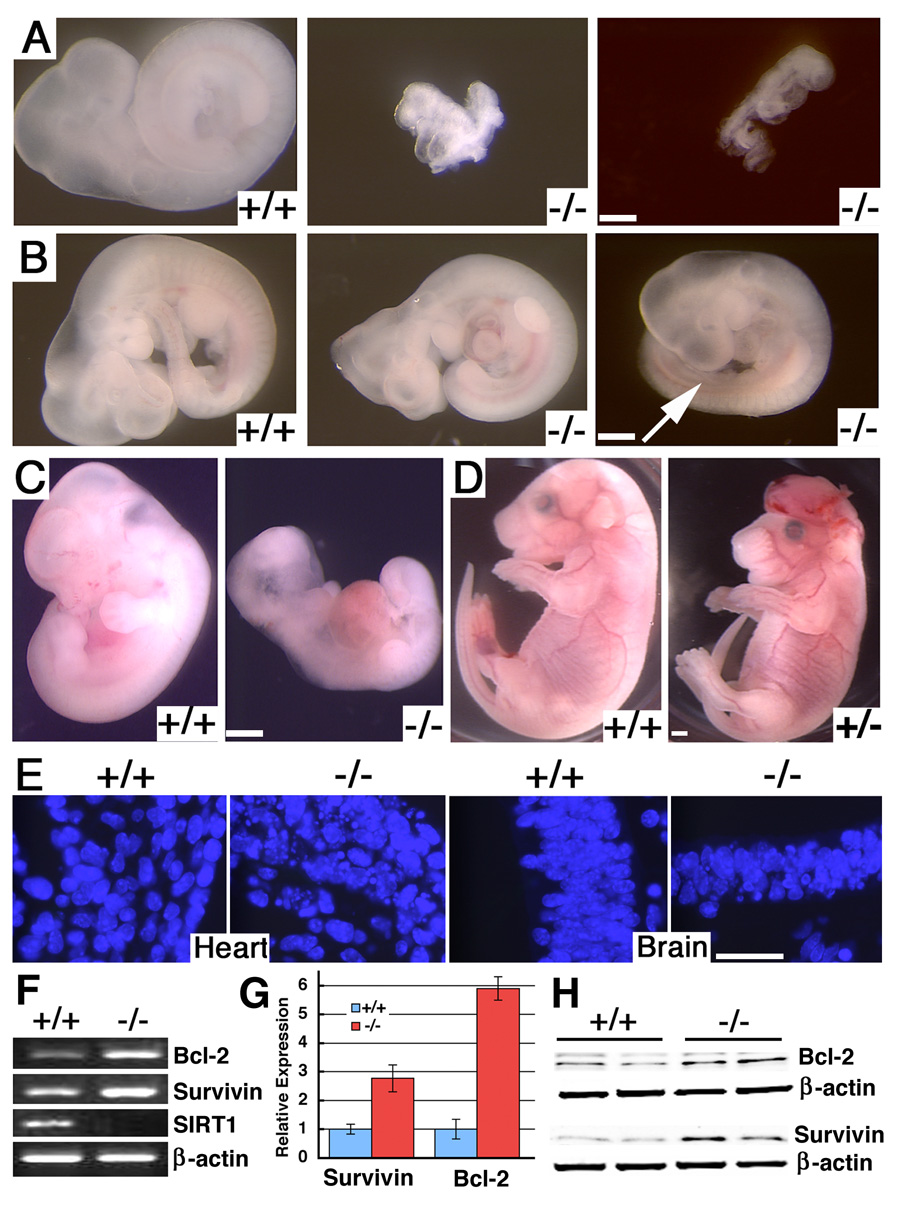
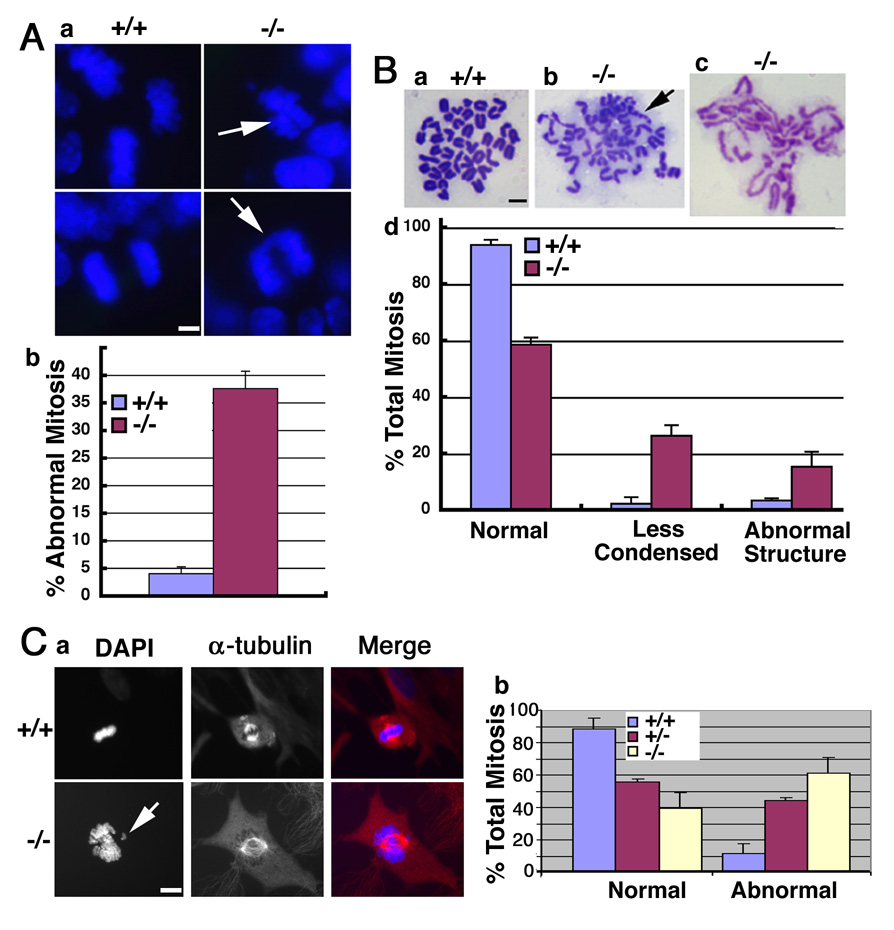
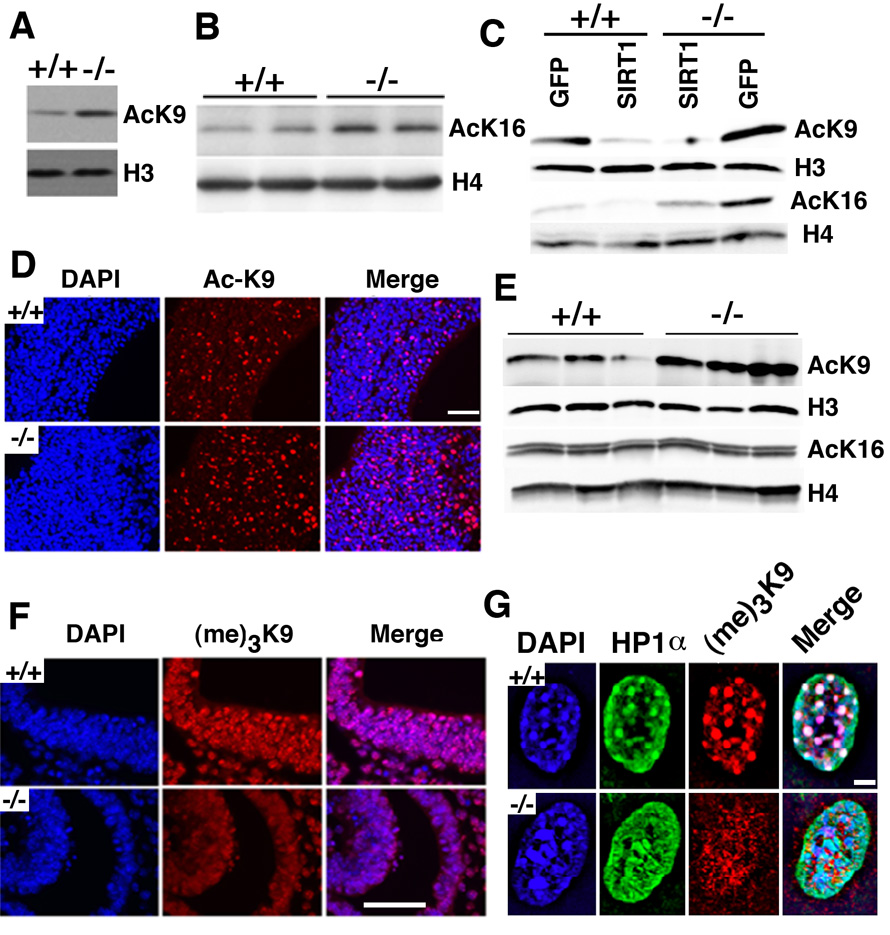
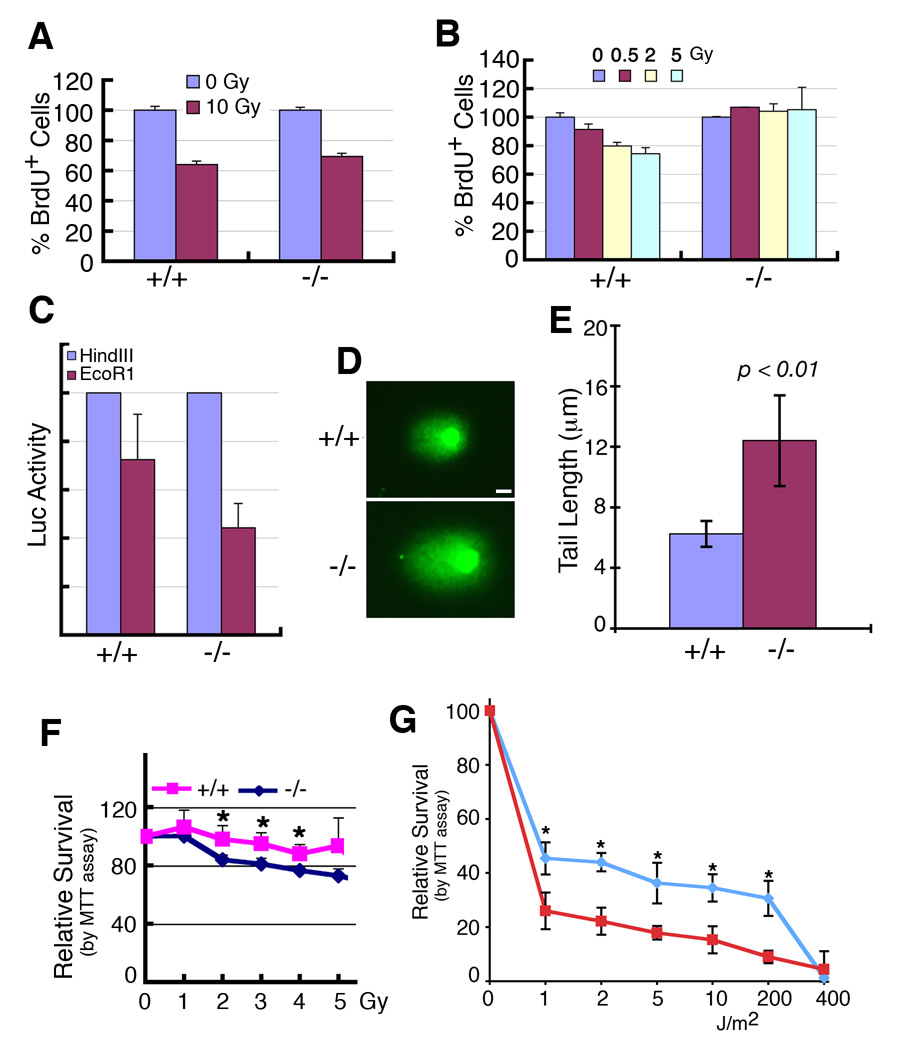
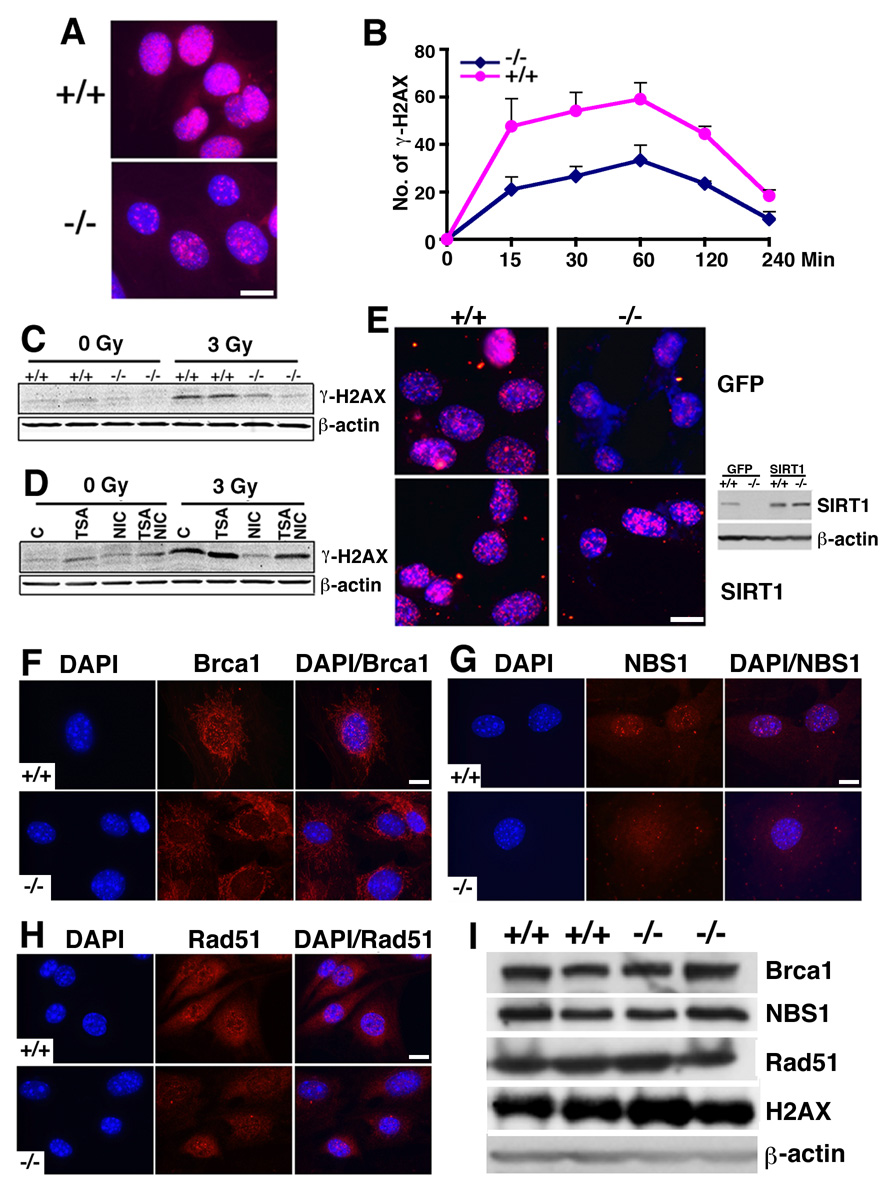
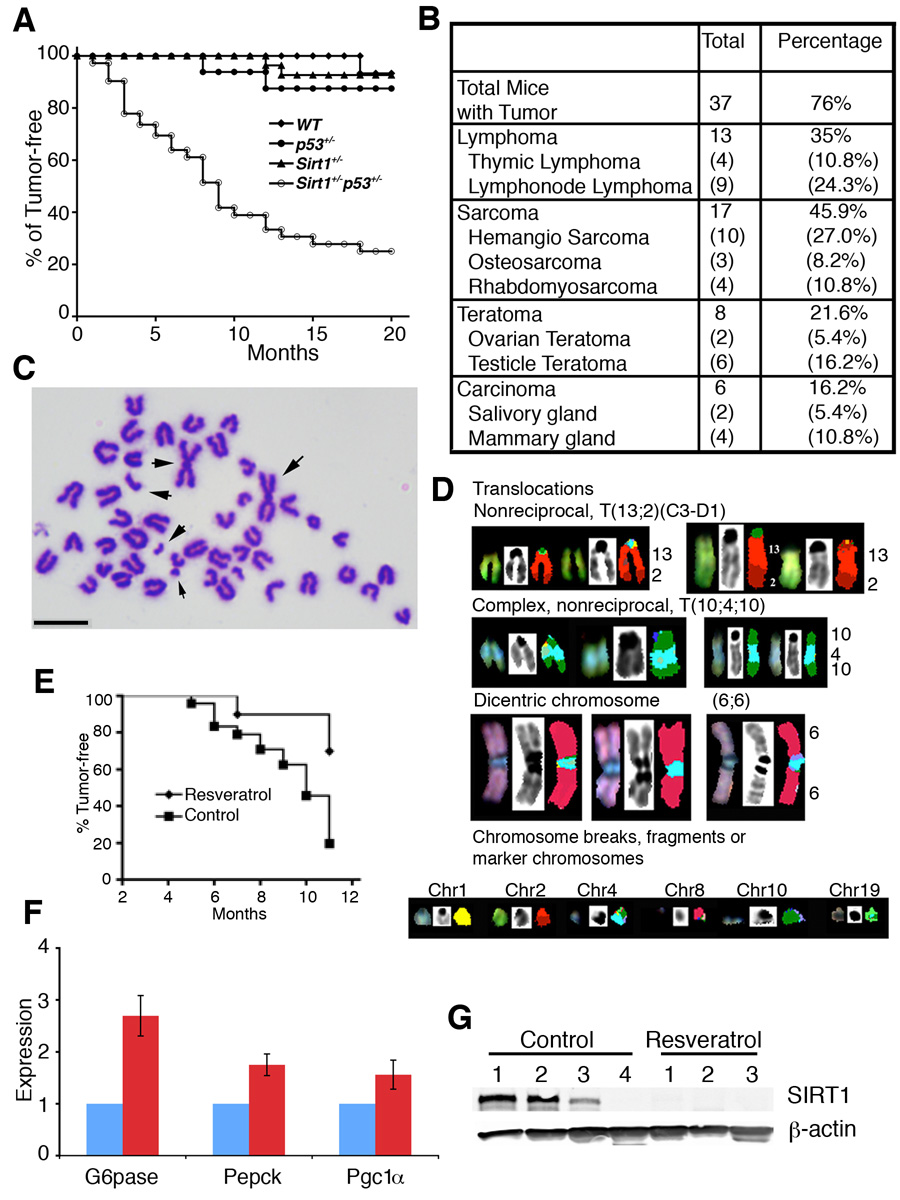
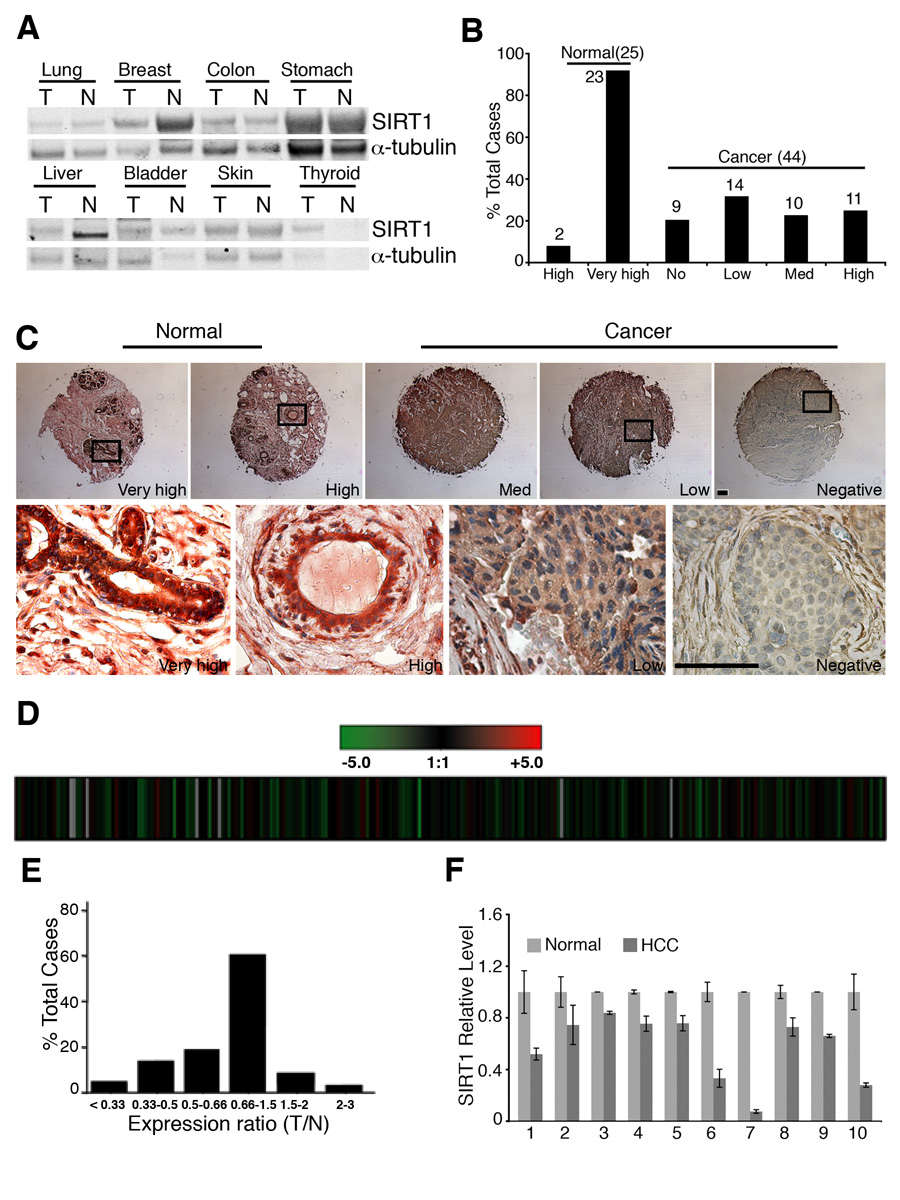
In lower eukaryotes, Sir2 serves as a histone deacetylase and is implicated in chromatin silencing, longevity, and genome stability. Here we mutated the Sirt1 gene, a homolog of yeast Sir2, in mice to study its function. We show that a majority of SIRT1 null embryos die between E9.5 and E14.5, displaying altered histone modification, impaired DNA damage response, and reduced ability to repair DNA damage. We demonstrate that Sirt1(+/-);p53(+/-) mice develop tumors in multiple tissues, whereas activation of SIRT1 by resveratrol treatment reduces tumorigenesis. Finally, we show that many human cancers exhibit reduced levels of SIRT1 compared to normal controls. Thus, SIRT1 may act as a tumor suppressor through its role in DNA damage response and genome integrity.


Figures

Figure 1
Figure 1. Deletion of SIRT1 resulted in embryonic lethality
(A) E9.5 wild type (+/+) and SIRT1 null embryos (−/−). Both mutant embryos are arrested at early E8, and one (middle) has not finished turning yet. (B) E11.25 +/+ and −/− embryos. Both −/− embryos are smaller with abnormal shape of the head, or lack of hindlimb bud (arrow). (C) E12.5 +/+ and −/− embryo. (D) E18.5 +/+ and SIRT1+/− embryos. (E) Dapi staining on brain histological sections of E11.5 +/+ and −/− embryo. (F–H) Expression of Bcl2 and Survivin in E11.5 +/+ and −/− embryos revealed by regular (F), realtime RT-PCR analysis (average ± SD) (G), and Western blot analysis (H). Bars: 500 µm for A–D, and 50 µm for E.
Figure 2
Figure 2. Deletion of SIRT1 causes chromosome abnormality
(A) Dapi staining of tissue sections showing abnormal mitotic features (arrows, A-a) in a E10.5 SIRT1−/− embryo. Data (A-b) were collected from 3 pairs of embryos, 200 mitotic phases from each embryo were counted. (B) Chromosome spreads from E9.5 embryos showing normal spread (B-a), aneuploid and abnormal structure, or broken chromosome (arrow, B-b), and less condensed chromosomes (B-c). Chromosome spreads from 9 pairs of embryos were made, and all the spreads from each individual embryo were counted. (C) SIRT1 mutant MEF cells displayed incompletely condensed, and lagging chromosomes (arrow, C-a), and uneven chromosome segregation under a relative normal spindle (α-tubulin staining). Data was summarized in (C-b). Data is presented as average ±SD. Bars: 10 µm for A–B, 20 µm for C.
Figure 3
Figure 3. SIRT1 deficiency changed epigenetic modification of chromatin
(A, B) Western blot analysis showing increased histone H3K9 (A) and H4K16 (B) levels in SIRT1−/− MEFs. (C) Reconstitution of SIRT1 in SIRT1−/− MEFs reduced histone H4K16 levels. (D, E) AC-K9 immunoflourescent staining of brain in E11 embryos. SIRT1−/− embryos displayed much more Ac-K9 staining than the +/+ embryos, which is confirmed by Western blot analysis. (F) (me)3-K9 immunoflourescent staining of embryo brain at E11. SIRT1−/− embryo displayed much less (me)3-K9 staining than the +/+ embryo. (G) In MEF cells, loss of SIRT1 impaired distribution of HP1α. Deletion of SIRT1 caused diffused localization compared with punctuated foci in +/+ embryos. Bars: 100 µm for D and F, and 10 µm for G.
Figure 4
Figure 4. Deletion of SIRT1 leads to impaired DNA damage repair and radiation sensitivity
(A, B) SIRT1 deletion caused impaired response to a low dosage of γ-irradiation (B), but not to high dosage (A) when assessed by BrdU incorporation 24 hours after the irradiation. (C) SIRT1 mutant cells exhibited impaired micro-homologous recombination, as revealed in cells transfected with a pGL2 Luc vector that was linearized with either HindIII or EcoRI. (D,E) Comet assay reveals that SIRT1−/− cells are incapable of repairing γ-irradiation induced double strand DNA damage efficiently. Comet assay was performed 2 hours after MEFs received 5Gy γ-irradiation. (F, G) −/− MEF cells are more sensitive than +/+ controls revealed by γ-irradiation (F), and UV (G). *: p< 0.05. All the data were obtained by analyzing at least 6 pairs of individual MEF cells at passage 1. Data is presented as average ±SD. Bars: 100 µm for D.
Figure 5
Figure 5. SIRT1 deficiency impairs γH2AX foci formation
(A) γH2AX foci formation was reduced 2 hrs post 3 Gy irradiation. (B) Time course showing reduced initiation of γH2AX foci in SIRT1 mutant cells. Six pairs of MEF cells at Passage 1 were irradiated with 3 Gy, and γH2AX foci number was counted in each individual cell. One hundred cells from each MEF cell were counted in both untreated and 3 Gy irradiated cells. *: p< 0.05. Data is presented as average ±SD. (C) Western blot showing significantly reduced γH2AX levels in SIRT1−/− than +/+ cells. (D) Treatment of nicotinomide diminished γH2AX levels in SIRT1+/+ cells. (E) Transfection of a vector carrying a wild type SIRT1 (pUse-SIRT1, Upsate), but not a GFP control, restored γH2AX foci formation in SIRT1−/− cells. SIRT1 expression levels were shown by Western blot analysis. (F–H) Immunofluorescent staining of Brca1, Rad51 and NBS1 in SIRT1+/+ or −/− MEF cells. Nuclear foci formation is reduced in the mutant cells. (I) Western blots showing no alteration in total protein levels of Brca1, Rad51, NBS1 and H2AX. Bars: 100 µm for A and E, and 10 µm for F–H.
Figure 6
Figure 6. SIRT1 deficiency causes genomic instability and tumor formation
(A) Tumor free curve of different genotypes mice, including SIRT1+/−p53+/− (n=49), p53+/− (n=12), SIRT1+/− (n=37), and WT (n=18). (B) Types and percentage of tumors developed in SIRT1+/−p53+/− mice. (C) Chromosome spread from a mammary tumor. Regardless of the tumor type, general events are aneuploidy, numerous structural chromosomal aberrations, and premature chromosome segregation. Arrow points to abnormally long chromosome created by end fusion. (D) SKY analysis on metaphase spreads from a primary tumor, showing non-reciprocal translocation (T(13;2)(C3-D1)), a complex non-reciprocal translocation (T(10;410)), dicentric chromosomes, and a variety of chromosomal fragments from chromosomes 1,2, 4, 8, 10 and 19 respectively. (E) Treatment of resveratrol reduced tumor incidence in SIRT1+/−p53+/− mice. Resveratrol group treated group consisted of 10 female mice. The control ground contained 10 DMSO treated and 16 untreated female mice. Logrank test: p<0.01. (F) Treatment of resveratrol caused altered expression of several known downstream genes of SIRT1. Data is presented as average ±SD. (G). Western blot analysis showing that all three tumors developed in the resveratrol treated SIRT1+/−p53+/− mice lost SIRT1 expression, while only one out of four tumors in the mock treated mice lost SIRT1 expression. Bar: 10 µm for C.
Figure 7
Figure 7. SIRT1 gene expression in human clinical cancers
(A) Levels of SIRT1 in 8 different cancers and their normal controls revealed by Western blot analysis. (B,C) SIRT1 protein levels between 44 breast cancers and 25 normal breast tissues revealed by tissue array. Levels of SIRT1 staining were classified as very high, high, medium, low and negative (B), and the actual immunochemical images were shown (C) The boxed region showed high levels of SIRT1 in normal epithelium and lowered levels in cancers. (D–F) SIRT1 expression levels in microarray data of 263 HCC samples, presented as raw log2 ratio (T/N) using previously described dataset (GEO accession number, GSE5975) (D), and bars (E). Realtime RT-PCR of 10 pairs of samples was also presented (F). Data shown is average ±SD. Bars: 100 µm for C.

References

    1. Aggarwal BB, Bhardwaj A, Aggarwal RS, Seeram NP, Shishodia S, Takada Y. Role of resveratrol in prevention and therapy of cancer: preclinical and clinical studies. Anticancer Res. 2004;24:2783–2840. - PubMed
    1. Antoccia A, Ricordy R, Maraschio P, Prudente S, Tanzarella C. Chromosomal sensitivity to clastogenic agents and cell cycle perturbations in Nijmegen breakage syndrome lymphoblastoid cell lines. Int J Radiat Biol. 1997;71:41–49. - PubMed
    1. Aziz MH, Afaq F, Ahmad N. Prevention of ultraviolet-B radiation damage by resveratrol in mouse skin is mediated via modulation in survivin. Photochem Photobiol. 2005;81:25–31. - PubMed
    1. Baur JA, Pearson KJ, Price NL, Jamieson HA, Lerin C, Kalra A, Prabhu VV, Allard JS, Lopez-Lluch G, Lewis K, et al. Resveratrol improves health and survival of mice on a high-calorie diet. Nature. 2006;444:337–342. - PMC - PubMed
    1. Blander G, Guarente L. The Sir2 family of protein deacetylases. Annu Rev Biochem. 2004;73:417–435. - PubMed

Publication types

MeSH terms