. 2008 Oct 17;29(4):602-14.
doi: 10.1016/j.immuni.2008.07.015. Epub 2008 Oct 2.

Imaging of effector memory T cells during a delayed-type hypersensitivity reaction and suppression by Kv1.3 channel block

Affiliations

Imaging of effector memory T cells during a delayed-type hypersensitivity reaction and suppression by Kv1.3 channel block

Melanie P Matheu et al. Immunity. .

Abstract

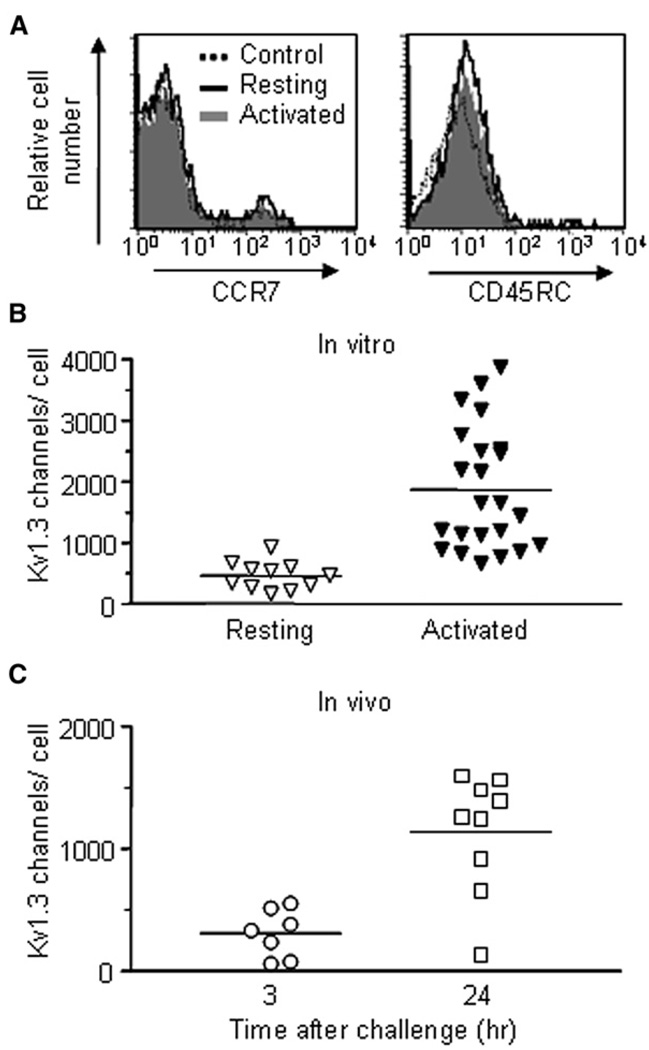
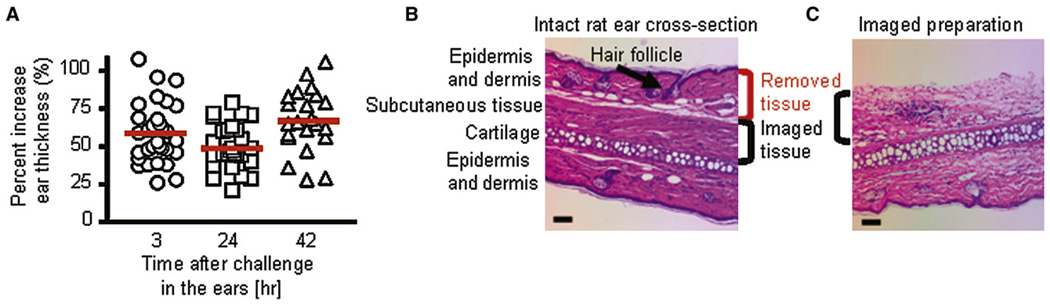
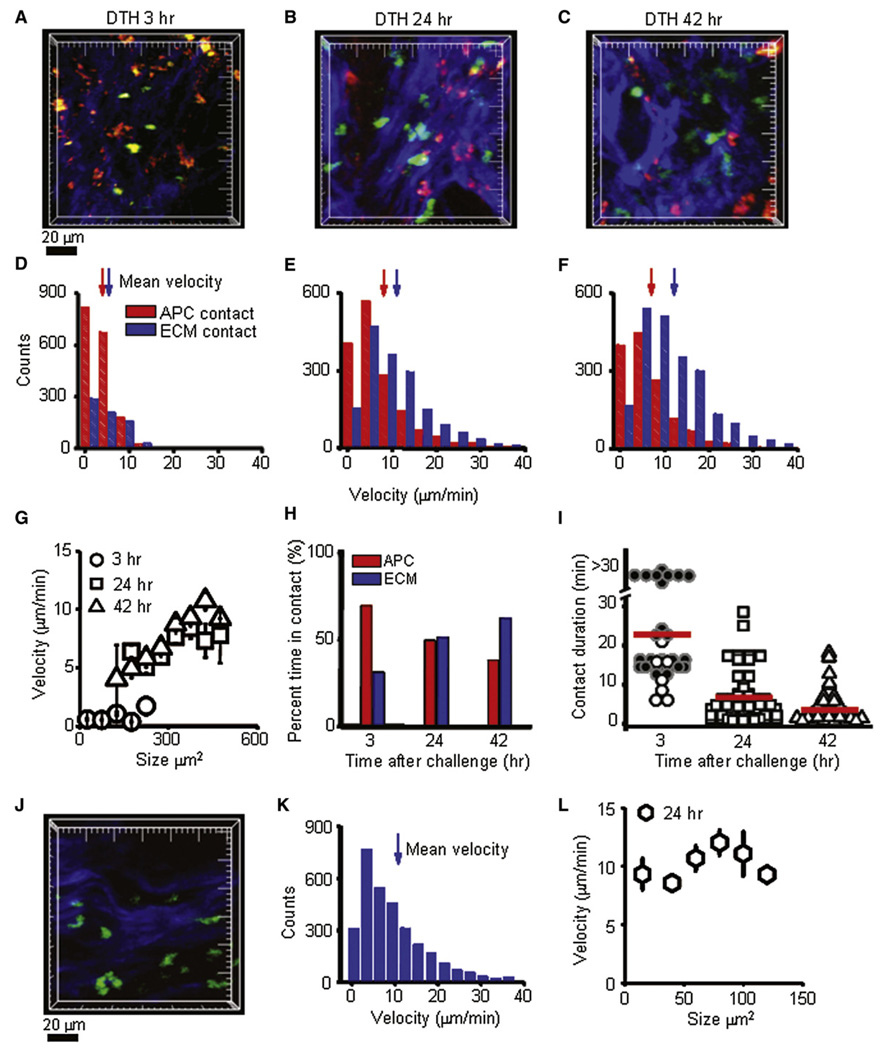
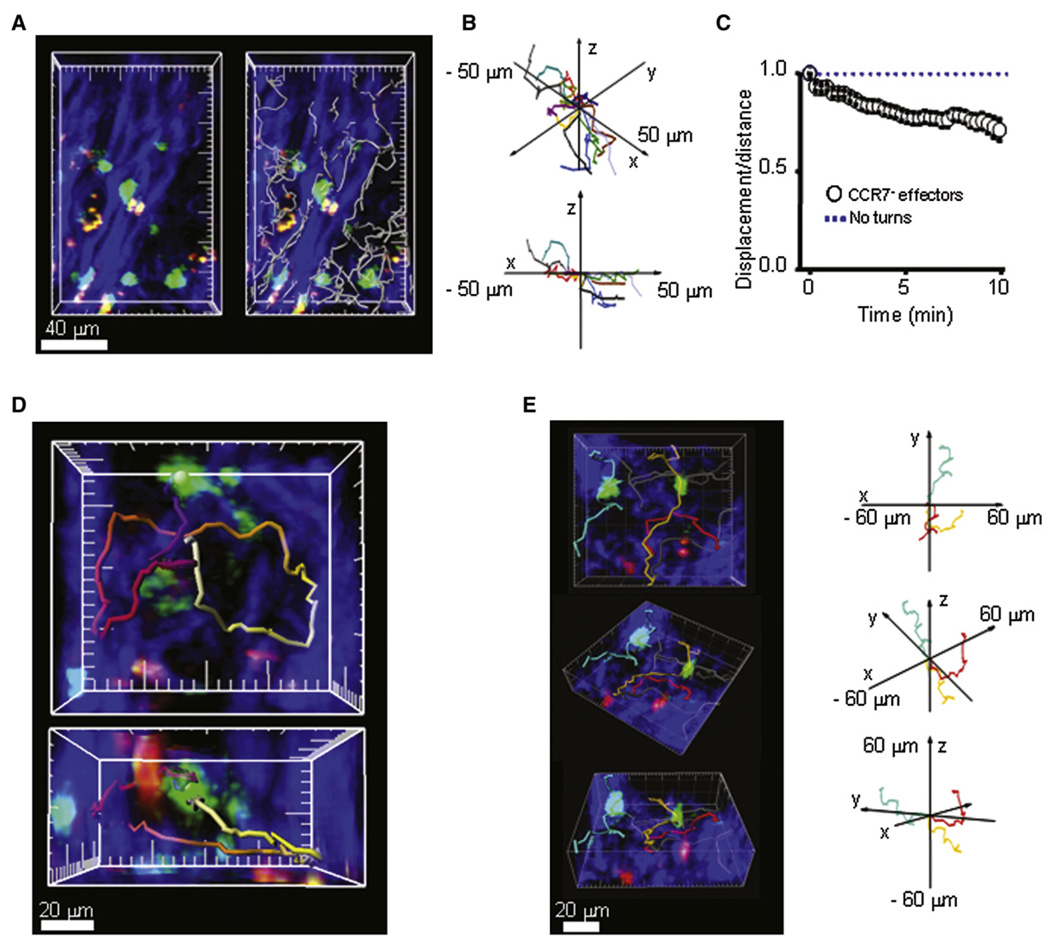
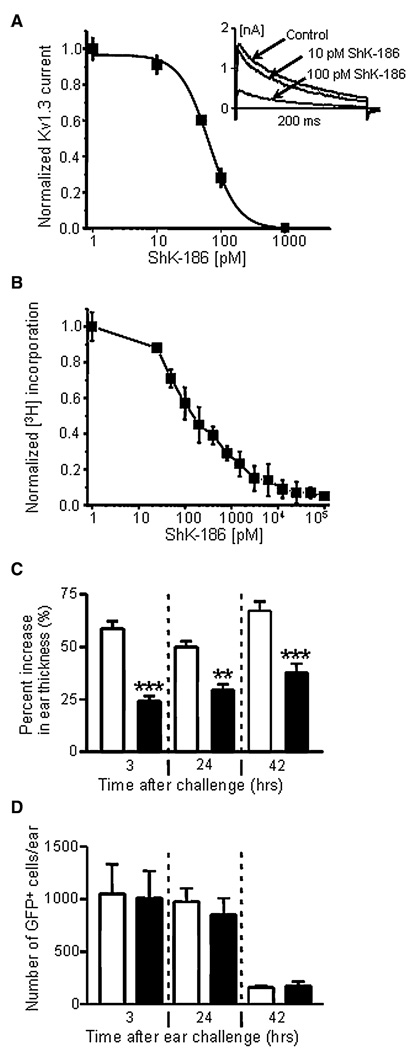
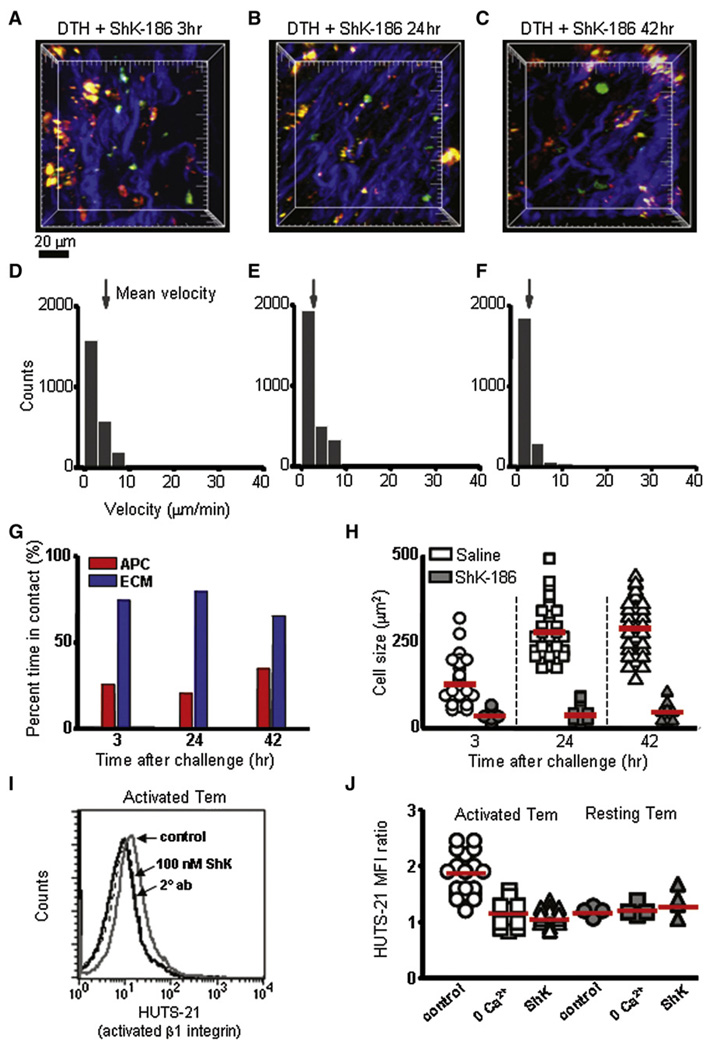
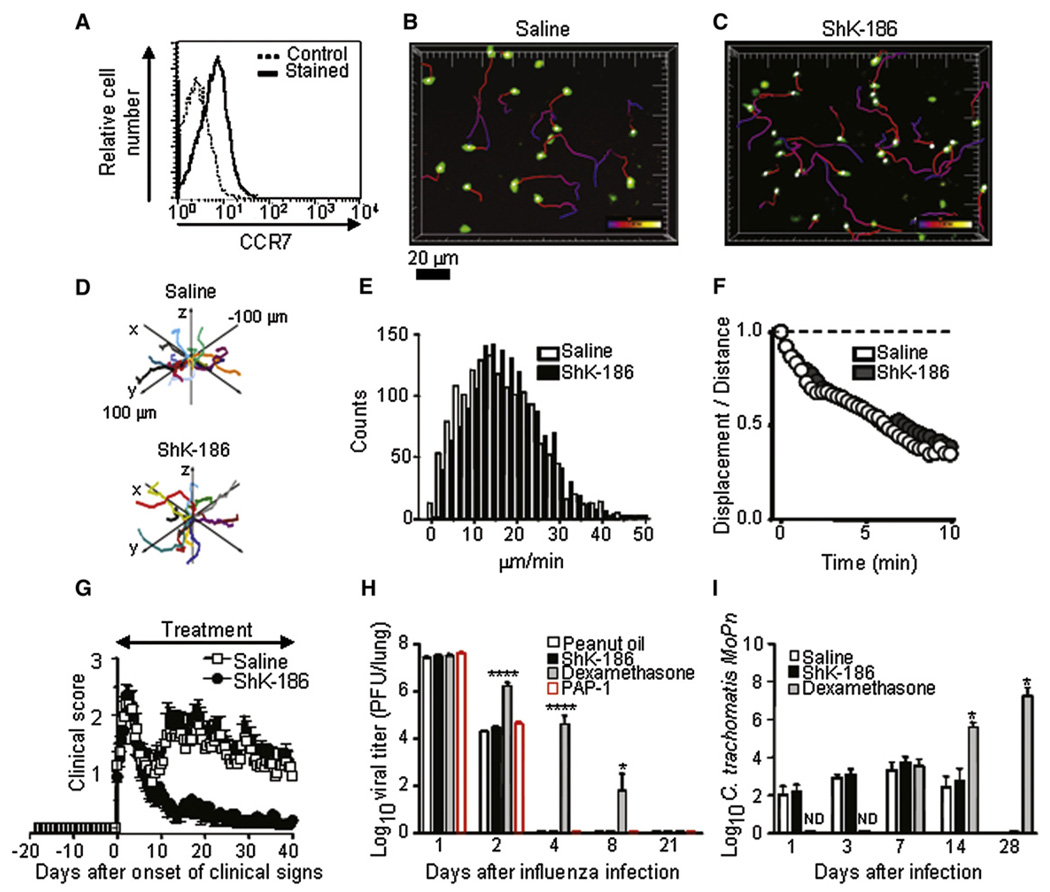
Effector memory T (Tem) cells are essential mediators of autoimmune disease and delayed-type hypersensitivity (DTH), a convenient model for two-photon imaging of Tem cell participation in an inflammatory response. Shortly (3 hr) after entry into antigen-primed ear tissue, Tem cells stably attached to antigen-bearing antigen-presenting cells (APCs). After 24 hr, enlarged Tem cells were highly motile along collagen fibers and continued to migrate rapidly for 18 hr. Tem cells rely on voltage-gated Kv1.3 potassium channels to regulate calcium signaling. ShK-186, a specific Kv1.3 blocker, inhibited DTH and suppressed Tem cell enlargement and motility in inflamed tissue but had no effect on homing to or motility in lymph nodes of naive and central memory T (Tcm) cells. ShK-186 effectively treated disease in a rat model of multiple sclerosis. These results demonstrate a requirement for Kv1.3 channels in Tem cells during an inflammatory immune response in peripheral tissues. Targeting Kv1.3 allows for effector memory responses to be suppressed while central memory responses remain intact.


Figures

Figure 1
Figure 1. Characterization of Ova-GFP T Cells
(A) Flow-cytometric analysis of the indicated cell-surface proteins on Ova-specific GFP+ CD4+ rat T cells. The cells are CCR7 CD45RC, characteristic of Tem cells (solid line = resting Ova-GFP+ T cells, dotted line = background staining; gray = activated). (B) Kv1.3 channel expression in resting (mean = 461 ± 69 Kv1.3 channels/cell, n = 11 cells) and activated (1862 ± 208 Kv1.3 channels/cell, n = 23)GFP+ CD4+ Ova-specific rat T cells. Data were obtained by patch-clamp analysis. (C) Kv1.3 channel expression in GFP+ Ova-specific T cells isolated from ears undergoing DTH, 3 hr (307 ± 74 Kv1.3 channels/cell, n = 7 cells) and 24 hr (1136 ± 162 Kv1.3 channels/cell, n = 9 cells) after challenge with Ova.
Figure 2
Figure 2. Induction of Adoptive DTH
(A) DTH assessed by measurement ofthe difference inear thickness(Δ ear thickness) between the Ova-TR-injected ear and the saline-injected ear and plotted as % change at different times after antigen challenge. (B) Hematoxylin and Eosin stain of a cross-section through an intact rat ear showing the various tissue layers, and indicating those layers removed for imaging. The scale bar represents 50 µm. (C) Rat ear section from an imaged preparation stained with Hematoxylin and Eosin. The scale bar represents 50 µm.
Figure 3
Figure 3. Activation and Motility of CCR7 Effector Cells at the Site of DTH
(A) GFP+ Ova-specific T cells (green) in subcutaneous ear tissue 3 hr after antigen injection interacting with local APCs (red) among collagen fibers (blue). Major tick marks = 20 µm. (B) Enlarged, highly motile CCR7 effector cells (green) 24 hr after antigen injection, imaged crawling along collagen-fiber bundles. (C) Large, highly motile CCR7 effectors in the subcutaneous tissue 42 hr after antigen injection. (D) Distributions of instantaneous velocities of CCR7 effector cells at 3 hr. Those in contact with an APC are shown by red bars (mean velocity 3.9 µm/min, n = 1722 measurements); those in contact with collagen are shown by blue bars (5.3 µm/min, n = 758; p < 0.05). (E) Corresponding velocity distributions of CCR7 effector cells 24 hr after antigen challenge. CCR7 effectors in contact with collagen fibers were highly motile (blue bars, 11.1 µm/min, n = 1654), whereas those contacting antigen-bearing APCs showed lower velocities (red bars, 7.4 µm/min, n = 1568; p < 0.05). (F) Velocity distributions of CCR7 effector cells contacting collagen (blue bars, 12.0 µm/min, n = 2213) or encountering an antigen-bearing APCs (red bars, 7.0 µm/min, n = 1359; p < 0.05) measured 42 hr after antigen challenge. (G) Mean velocities of CCR7 effector cells as a function of their cross-sectional areas at different times during DTH. Values were expressed as mean ± standard error (SE). (H) Percentages of time for which CCR7 effectors were in contact with local APCs or collagen fibers at 3 hr (APC: 69%, collagen: 31%), 24 hr (APC: 49%, collagen: 51%), and 42 hr (APC: 38%, collagen: 62%) after antigen challenge. n ≥ 50 cells. (I) Duration of CCR7 effector T cell contacts with local APCs at varying times after antigen challenge; mean contact durations are represented by red bars at 3 hr (24 min, n = 54 contacts in 6 experiments), 24 hr (7 min, n = 77 contacts in 3 experiments), and 42 hr (3.5 min, n = 55 contacts in 3 experiments). (J) Bystander GFP+ Ova-specific T cells (green) among collagen fibers (blue) in subcutaneous ear tissue 24 hr after induction of active DTH by injection of hen-egg lysozyme (HEL). Development of the DTH response was measured by ear swelling (44% increase in ear thickness, n = 2). Major tick marks = 20 µm. (K) Velocity distribution of bystander GFP+ Ova-specific T cells (mean velocity 10.4 µm/min, n = 5222). (L) Mean velocities of bystander GFP+ Ova-specific T cells as a function of their cross-sectional area 24 hr after induction of active DTH. Values were expressed as mean ± SE.
Figure 4
Figure 4. CCR7 Effector Cells Preferentially Crawl along Collagen Fibers
(A) Representative image of effector T cells in the collagen-rich subcutaneous tissue obtained 24 hr after antigen challenge. Left panel is a ‘‘top-view’’ compression through an image stack captured at a single time point; right panel overlays cell tracks recorded throughout a 4 min imaging sequence, illustrating movement of T cells along collagen fibers. (B) Cell tracks plotted normalizing the orientation of adjacent collagen fibers along the x axis. The 3D plots of effector cell tracks demonstrate preferential motility along the x axis (i.e., parallel to the collagen-fiber bundles). (C) Meander index (displacement from origin/distance traveled) for effector cells in regions of long collagen fibers (0.75 after 10 min; n = 20 cells). By comparison, the meander index over this period is typically 0.4 for random movement of naive T cells in a lymph node (cf. Figure 7F), and would be 1.0 for cells traveling in a straight line. Values were expressed as mean ± SE. (D) Cell tracks illustrating the circuitous paths at collagen-fiber junctions. Panels show compressions along the z (upper) and y (lower) axes: tracks are pseudocolored, representing time throughout a 36 min imaging record (purple = start; white = finish). Major tick marks are at 20 µm. (E) Left panel shows examples of cells moving between adjacent collagen fibers (red and gold tracks) and a cell traversing local collagen structures (turquoise track), depicted in various orientations. Right panel shows 3D plots of these same tracks after normalization of their starting points, and with the turquoise track reoriented to the opposite axis for better visualization.
Figure 5
Figure 5. Inhibition of Kv1.3 Currents, Cell Proliferation, and DTH by ShK-186
(A) Dose-dependent inhibition of Kv1.3 currents in Ova-specific GFP+ CCR7 effectors by ShK-186. Kd = 65 ± 5 pM; n = 3 cells. Inset shows representative Kv1.3 current traces in the absence or presence of 10 pM or 100 pM ShK-186. (B) Dose-dependent inhibition of CCR7 T cell proliferation by ShK-186. IC50 = 180 ± 37 pM; n = 3 experiments. (C) Suppression of DTH-induced ear swelling by administration of 100 µg/kg ShK-186 at the time of antigen challenge and 24 hr after antigen challenge (filled bars), relative to saline-treated rats (open bars). ** p < 0.01; *** p < 0.05. (D) Recovery of Ova-specific GFP+ CCR7 effectors from whole ear tissue from saline-treated (open bars) and ShK-186-treated animals (filled bars). Rats were extensively cardiac perfused with saline to remove cells from blood vessels before the ears were explanted and analyzed for GFP+ cells (n = 5 rats). Values were expressed as mean ± standard deviation (SD).
Figure 6
Figure 6. Inhibition of CCR7 Effector Cell Motility and Activation by ShK-186
(A–C) Maximum-intensity projections of two-photon image stacks acquired in the subcutaneous ear tissue at 3, 24, and 42 hr after antigen challenge and treatment with ShK-186. Ova-specific GFP+ CCR7 effector cells (green), collagen-fiber bundles (blue), and APCs bearing Ova-TR (red) are shown. Major tick marks = 20 µm. (D–F) Distributions of instantaneous velocities of CCR7 effectors cells in ShK-186-treated animals at corresponding time points after Ova-TR challenge. Arrows mark mean velocities (3 hr: 2.7 ± 0.04 µm/min, n = 2397 measurements; 24 hr: 2.1 ± 0.05 µm/min, n = 2870; 42 hr: 1.2 ± 0.04 µm/ min, n = 2227). (G) Percentage of time effector cells contacted APCs (red bars) or collagen (blue bars) at different time points after Ova-TR challenge (n = 34–46 cells in 3 or 4 experiments). (H) Sizes (cross-sectional area) of CCR7 effector cells in saline-treated (open symbols) and in ShK-186-treated animals (filled symbols) at different times after Ova-TR challenge. Mean values are indicated by red bars (in saline-treated animals at 3, 24, and 42 hr after antigen challenge, respectively, 130 ± 9.6, 280 ± 11.0 µm2, and 289 ±11.6 µm2; in ShK-186-treated animals, 32 ± 2.5, 38 ± 4.1, and 44 ± 4.µm2). (I) FACS plots of activated β1 integrin (exposed amino acids 355–425) on the surface of activated Tem cells with and without ShK treatment. Activated Tem cells have the activated form of β1 integrin on the cell surface (gray solid line), which is suppressed by 100 nM ShK-186 (black solid line) to levels similar to control staining (two overlapping dotted lines, left panel). (J) Mean fluorescence intensity (MFI) ratios (HUTS-21 staining/secondary control) for activated Tem cells (1.8 ± 0.08 SE, n = 21) were significantly higher (p < 0.01) than in activated Tem incubated in 0 Ca2+ solution (1.1 ± 0.07 SE, n = 12) or treated with 100 nM ShK (1.06 ± 0.03 SE, n = 17). Resting Tem cells (day 6) had low levels of activated β1 integrin that were not significantly different (p≥0.44) than in control conditions (2 mM Ca2+;1.2 ± 0.04, SE, n = 4), 0 Ca2+ (1.2 ± 0.05, n = 4), or with ShK treatment (1.3 ±0.12, n = 4).
Figure 7
Figure 7. CCR7+ T Cell Motility in the Lymph Node and Evaluation of Three Disease Models
(A) Adoptively transferred CD3+ T cells are CCR7+. Solid line = CCR7 staining; dotted line = background staining. The tissue-weight-normalized number of cells recovered from lymph nodes of saline- and ShK-186-treated animals did not differ, indicating no effect of ShK-186 treatment on homing to lymph node (data not shown, n = 2 for each condition). (B and C) Images show maximum-intensity projection ‘‘snapshots’’ of CD3+ CCR7+ T cells in an inguinal lymph node 3 hr after treatment with saline or ShK-186 (100 µg/kg), respectively. Pseudocolored cell tracks depict T cell movements over 6 min. (D) Representative 3D displacement plots of T cells in saline-treated (top) and ShK-186-treated lymph nodes (bottom) after normalizing starting coordinates. (E) Distributions of instantaneous velocities of saline-treated (white) and ShK-186-treated (black) CD3+ CCR7+ T cells. Mean values (16.6 and 16.2 µm/min, respectively) are not statistically different. (F) Meander index (displacement from origin/distance traveled) as a function of time for CCR7+ T cells in lymph nodes from saline-treated (open circles) and ShK-186-treated animals (closed circles). (G) Effect of ShK-186 on the course of CR-EAE. White, saline subcutaneous injection, n = 14 rats; black, ShK-186 100 µg/kg/day subcutaneous injection, n = 15 rats. (H) Lack of effects of ShK-186 and PAP-1 on clearance of rat-adapted influenza virus. White, peanut oil orally, n = 5; red, PAP-1 50 mg/kg/day orally; black, ShK-186 100 µg/kg/day subcutaneous injection, n = 5 rats; gray, dexamethasone 2 mg/kg/day orally, n = 5. * p < 0.05, **** p < 0.01. (I) Lack of effects of ShK-186 on clearance of Chlamydia trachomatis. White, saline subcutaneous injection, n = 10; black, ShK-186 100 µg/kg/day subcutaneous injection, n = 10; gray, dexamethasone 2 mg/kg/day subcutaneous injection, n = 4. Values were expressed as mean ± SD.

References

    1. Andreasen SO, Thomsen AR, Koteliansky VE, Novobrantseva TI, Sprague AG, de Fougerolles AR, Christensen JP. Expression and functional importance of collagen-binding integrins, alpha 1 beta 1 and alpha 2 beta 1, on virus-activated T cells. J. Immunol. 2003;171:2804–2811. - PubMed
    1. Azam P, Sankaranarayanan A, Homerick D, Griffey S, Wulff H. Targeting effector memory T cells with the small molecule Kv1.3 blocker PAP-1 suppresses allergic contact dermatitis. J. Invest. Dermatol. 2007;127:1419–1429. - PMC - PubMed
    1. Beeton C, Chandy KG. Induction and monitoring of adoptive delayed type hypersensitivity in rats. J. Visualized Experiments 8. 2007 Published online October 1 2007. 10.3791/325. - PMC - PubMed
    1. Beeton C, Wulff H, Barbaria J, Clot-Faybesse O, Pennington M, Bernard D, Cahalan MD, Chandy KG, Beraud E. Selective blockade of T lymphocyte K+ channels ameliorates experimental autoimmune encephalomyelitis, a model for multiple sclerosis. Proc. Natl. Acad. Sci. USA. 2001:13942–13947. - PMC - PubMed
    1. Beeton C, Pennington MW, Wulff H, Singh S, Nugent D, Crossley G, Khaytin I, Calabresi PA, Chen CY, Gutman GA, Chandy KG. Targeting effector memory T cells with a selective peptide inhibitor of Kv1.3 channels for therapy of autoimmune diseases. Mol. Pharmacol. 2005;67:1369–1381. - PMC - PubMed

Publication types

MeSH terms