. 2008 Dec 1;324(1):88-98.
doi: 10.1016/j.ydbio.2008.09.010. Epub 2008 Sep 19.

Osr1 expression demarcates a multi-potent population of intermediate mesoderm that undergoes progressive restriction to an Osr1-dependent nephron progenitor compartment within the mammalian kidney

Affiliations

Osr1 expression demarcates a multi-potent population of intermediate mesoderm that undergoes progressive restriction to an Osr1-dependent nephron progenitor compartment within the mammalian kidney

Joshua W Mugford et al. Dev Biol. .

Abstract

The mammalian metanephric kidney is derived from the intermediate mesoderm. In this report, we use molecular fate mapping to demonstrate that the majority of cell types within the metanephric kidney arise from an Osr1(+) population of metanephric progenitor cells. These include the ureteric epithelium of the collecting duct network, the cap mesenchyme and its nephron epithelia derivatives, the interstitial mesenchyme, vasculature and smooth muscle. Temporal fate mapping shows a progressive restriction of Osr1(+) cell fates such that at the onset of active nephrogenesis, Osr1 activity is restricted to the Six2(+) cap mesenchyme nephron progenitors. However, low-level labeling of Osr1(+) cells suggests that the specification of interstitial mesenchyme and cap mesenchyme progenitors occurs within the Osr1(+) population prior to the onset of metanephric development. Furthermore, although Osr1(+) progenitors give rise to much of the kidney, Osr1 function is only essential for the development of the nephron progenitor compartment. These studies provide new insights into the cellular origins of metanephric kidney structures and lend support to a model where Osr1 function is limited to establishing the nephron progenitor pool.


Figures

Figure 1
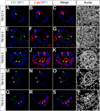
Figure 1. Metanephric progenitor domains are established by E10.5
(A–X) Immunofluorescent confocal microscopy of transverse sections of the E10.5 metanephric blastema (A–D, M–P), saggital sections of E12.5 metanephric kidneys (E–H, Q–T) and frontal sections of E15.5 metanephric kidneys (I–L, U–X). Samples immunostained for Foxd1 (A, E, I), Pax2 (B, F, J, N, R, V) and Six2 (M, Q, U). Nuclei stained for Hoechst 33258 (D, H, L, P, T, X). Merged images (C, G, K, O, S, W). Dashed lines (A–X) indicate nephric duct epithelia. Scale bars = 50µm.
Figure 2
Figure 2. Osr1+ cells give rise to the ureteric epithelium between E7.5 and E9.5
(A–T) Immunofluorescent confocal microscopy of E15.5 Osr1GCE/+;R26R metanephric kidneys after Cre activation at E7.5 (A–D), E8.5 (E–H), E9.5 (I–L), E10.5 (M–P) and E11.5 (Q–T). Samples immunostained for Cytokeration (A, E, I, M, Q) and β-gal (B, F, J, N, R). Nuclei stained for Hoechst 33258 (D, H, L, P, T). Merged images (C, G, K, O, S). Scale bar = 50µm.
Figure 3
Figure 3. Osr1+ cells give rise to cortical interstitial mesenchyme precursors between E7.5 and E11.5
(A–T) Immunofluorescent confocal microscopy of E15.5 Osr1GCE/+;R26R metanephric kidneys after Cre activation at E7.5 (A–D), E8.5 (E–H), E9.5 (I–L), E10.5 (M–P) and E11.5 (Q–T). Samples immunostained for Foxd1 (A, E, I, M, Q) and β-gal (B, F, J, N, R). Nuclei stained for Hoechst 33258 (D, H, L, P, T). Merged images (C, G, K, O, S). Dashed lines (A–T) indicate the ureteric epithelium. Arrowheads (A–C, E–G, I–K, M–O) indicate Foxd1+, β-gal+ cells. Arrowheads (Q-S) indicate Foxd1, β-gal+ cells. Scale bar = 50µm.
Figure 4
Figure 4. Osr1+ cells always give rise to the cap mesenchyme
(A–T) Immunofluorescent confocal microscopy E15.5 Osr1GCE/+;R26R metanephric kidneys after Cre activation at E7.5 (A–D), E8.5 (E–H), E9.5 (I–L), E10.5 (M–P) and E11.5 (Q–T). Samples immunostained for Six2 (A, E, I, M, Q) and β-gal (B, F, J, N, R). Nuclei stained for Hoechst 33258 (D, H, L, P, T). Merged images (C, G, K, O, S). Dashed lines (A–T) indicate the ureteric epithelium. Arrowheads (A–C, E–G, I–K, M–O, Q–S) indicate Six2+, β-gal+ cells. Scale bar = 50µm.
Figure 5
Figure 5. Osr1+ cells give rise to the renal vasculature between E7.5 and E9.5
(A–T) Immunofluorescent confocal microscopy of glomeruli within E15.5 Osr1GCE/+;R26R metanephric kidneys after Cre activation at E7.5 (A–D), E8.5 (E–H), E9.5 (I–L), E10.5 (M–P) and E11.5 (Q–T). Samples immunostained for Flk1 (green in A, E, I, M, Q), WT1 (blue in A, B, E, F, I, J, M, N, Q, R) and β-gal (B, F, J, N, R). Nuclei stained for Hoechst 33258 (D, H, L, P, T). Merged images (C, G, K, O, S). Arrowheads (A–C, E–G) indicate Flk1+, β-gal+ cells. Arrowheads (I–K, M–O) indicate Flk1, β-gal+ cells. Concave arrowheads (E–G, I–K, M–O, Q–S) indicate WT1+, β-gal+ cells. Scale bar = 50µm.
Figure 6
Figure 6. Distinct Osr1+ cells give rise to Foxd1+ and Pax2+ between E9.5 and E10.5
(A–O) Immunofluorescent confocal microscopy of transverse sections of the E10.5 metanephric blastema immunostained for Foxd1 (A, F, K), Pax2 (B, G, L) and β-gal (C, H, M). Merged images (D, I, N). Nuclei stained for Hoechst 33258 (E, J, O). Brackets (A–D, F–I, K–L) indicate a distance of 10µm between to adjacent β-gal+ cells. Yellow arrows (E, J, O) indicate nuclei of adjacent β-gal+ cells. Insets (D, J, N) are zoomed views of bracketed cells. Scale bars = 50µm.
Figure 7
Figure 7. Osr1 function is only required for the formation of the cap mesenchyme
(A–T) Immunofluorescent confocal microscopy of transverse sections of the E10.5 metanephric blastema in Osr1GCE/+ control (A–E, K–O) and Osr1GCE/GCEN mutant (F–J, P–T) embryos. Samples immunostained for Foxd1 (A, F), Hoxd11 (K, P), Pax2 (B, G, L, Q), and GFP (C, H, M, R). Merged images (D, I, N, S). Nuclei stained for Hoechst 33258 (E, J, O, T). Dashed lines (A–D, F–I, K–N, P–T) indicate the nephric duct epithelia. Arrowheads (A–D, F–I) indicate Foxd1+, Pax2 , GFP+ cells. Arrowheads (K–N, P–S) indicate Hoxd11+, Pax2, GFP+ cells. Concave arrowheads (K–N) indicate Hoxd11+, Pax2+, GFP+ cells. Scale bar = 50µm.
Figure 8
Figure 8. Osr1+ cell fates are restricted during the development of the metanephric kidney
Schematic representation of fate restriction within the Osr1+ progenitor population during the development of the metanephric kidney.

References

    1. Bernstein J, Cheng F, Roszka J. Glomerular differentiation in metanephric culture. Lab Invest. 1981;45:183–190. - PubMed
    1. Boyle S, Misfeldt A, Chandler KJ, Deal KK, Southard-Smith EM, Mortlock DP, Baldwin HS, de Caestecker M. Fate mapping using Cited1-CreERT2 mice demonstrates that the cap mesenchyme contains self-renewing progenitor cells and gives rise exclusively to nephronic epithelia. Dev Biol. 2008;313:234–245. - PMC - PubMed
    1. Carroll TJ, Park JS, Hayashi S, Majumdar A, McMahon AP. Wnt9b plays a central role in the regulation of mesenchymal to epithelial transitions underlying organogenesis of the mammalian urogenital system. Dev Cell. 2005;9:283–292. - PubMed
    1. Challen GA, Bertoncello I, Deane JA, Ricardo SD, Little MH. Kidney side population reveals multilineage potential and renal functional capacity but also cellular heterogeneity. J Am Soc Nephrol. 2006;17:1896–1912. - PubMed
    1. Costantini F. Renal branching morphogenesis: concepts, questions, and recent advances. Differentiation. 2006;74:402–421. - PubMed

Publication types

MeSH terms