Review
. 2008 Dec;31(12):599-608.
doi: 10.1016/j.tins.2008.08.008. Epub 2008 Oct 4.

Forward frontal fields: phylogeny and fundamental function

Affiliations
Review

Forward frontal fields: phylogeny and fundamental function

Steven P Wise. Trends Neurosci. 2008 Dec.

Abstract

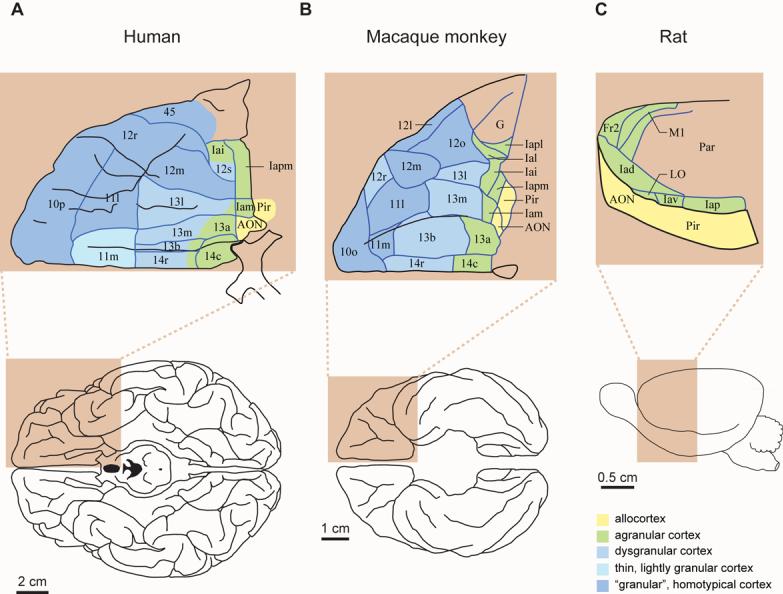
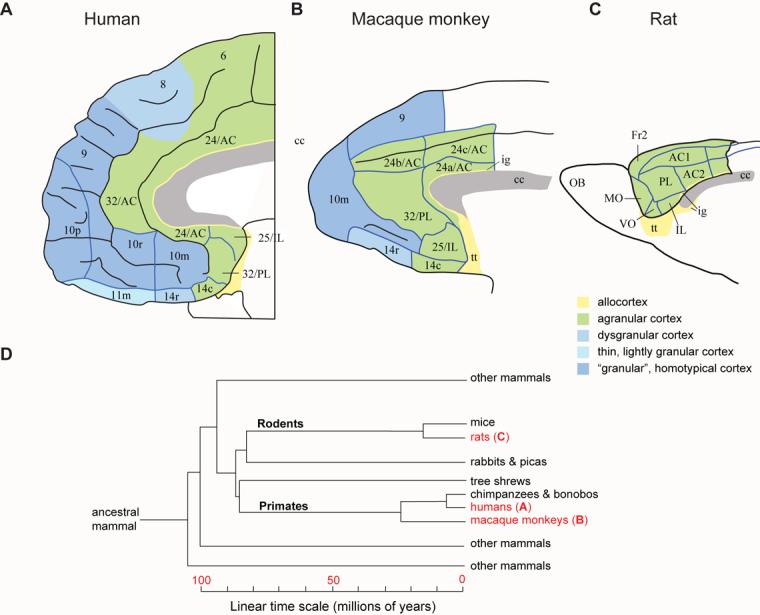
The largest part of the primate prefrontal cortex has no homolog in other mammals. Accordingly, it probably confers some advantage that other mammals either lack or attain through the function of other structures. Yet, this advantage remains enigmatic. This is not so for other parts of the cortex. For example, certain visual areas encode, represent and store knowledge about objects. By analogy, perhaps the primate prefrontal cortex encodes, represents and stores knowledge about behaviors, including the consequences of doing (or not doing) something in complex and challenging situations. The long list of functions often attributed to the prefrontal cortex could contribute to knowing what to do and what will happen when rare risks arise or outstanding opportunities knock.


Figures

Figure 1
Figure 1
Top: Architectonic maps of the orbitofrontal cortex in humans (A) and macaque monkeys (B), and lateral frontal cortex in rats (C). Bottom: ventral views of a human (A) and monkey (B) brain; lateral view of a rat brain (C). The “granular” areas appear in blue; agranular areas in green; allocortical areas in yellow. Note that the “granular” prefrontal cortex dominates the frontal lobe of primates. Abbreviations: AON, anterior olfactory “nucleus”; Fr2, second frontal area; I, insula; LO, lateral orbital area; M1, primary motor area; Par, parietal cortex; Pir, Piriform cortex; l, lateral; m, medial; o, orbital; r, rostral; c, caudal; i, inferior; p, posterior; s, sulcal; v, ventral. a has two meanings: in Ia, it means agranular; in 13a, it distinguishes that area from area 13b. Architectonics from Öngür et al. [20] (A), Carmichael and Price [21] (B), and Palomero-Gallagher and Zilles [22] (C). All parts of the figure were adapted from their source.
Figure 2
Figure 2
A–C: Architectonic maps of the medial frontal cortex, corresponding to Figure 1A–C. Abbreviations and color code as in Fig. 1, plus: AC, anterior cingulate area; cc, corpus callosum; IL, infralimbic cortex; MO, medial orbital area; PL, prelimbic cortex; VO, ventral orbital area; numbers indicate cortical fields, except that after certain areas, such as Fr2 and AC1, they indicate subdivisions of cortical fields. D: Simplified cladogram of mammals, indicating the divergence times of selected groups. The letters (A-C) after the groups in red refer to the corresponding parts of Figures 1 and 2. Time scale in millions of years before the present. Architectonics from Öngür et al. [20] (A), Carmichael and Price [21] (B), and Palomero-Gallagher and Zilles [22] (C). A-C were adapted from their source.
Figure 3
Figure 3
Primary data on certain corticostriatal projections. The infralimbic cortex (roughly area 25 in primates) sends projections to the shell of the nucleus accumbens and nearby striatum in both rats (A, C) and macaque monkeys (B, D), as demonstrated by both anterograde (A, B) and retrograde (C, D) axonal tracing methods. A, B. Stippling indicates the termination zones of corticostriatal projections. C. Red ovals surround infralimbic corticostriatal cells (filled black circles) that project to the shell of the nucleus accumbens, with the arrow pointing to the injection site for the tracer. Prelimbic cortex (green ovals), roughly subgenual area 32 in primates, and agranular insular cortex (orange ovals) also send a corticostriatal projection to the shell of nucleus accumbens. D. Red circles show the locations of corticostriatal cells projecting to the nucleus accumbens, with the injection site shown by the red spot in the inset. The numbers indicate cortical areas as in Figures 1 and 2. All parts of the figure were adapted from their source. A from Berendse, H.W. et al., Journal of Comparative Neurology, Vol. 316, No. 3, 1992, pp. 314-347, Copyright 1992, reprinted with permission of Wiley-Liss, Inc., a subsidiary of John Wiley & Sons, Inc. [27]. B from Haber, S.N. et al., Journal of Neuroscience, Vol. 26, 2006, pp. 8368-8376, reprinted with permission of the Journal of Neuroscience [26]; C from Brog, J.S. et al., Journal of Comparative Neurology, Vol. 338, No. 2, 1993, pp. 255-278, Copyright 1993, reprinted with permission of Wiley-Liss, Inc., a subsidiary of John Wiley & Sons, Inc. [24]. D from Haber, S.N. et al, Journal of Neuroscience, Vol. 15, 1995, pp. 4851-4867, reprinted with permission of the Journal of Neuroscience [25].
Figure 4
Figure 4
A. Percent correct choices in a memory task with three delay intervals. Monkeys with lesions of the dorsal prefrontal cortex (blue) perform like intact monkeys (green) when they must remember a sample object for 2 minutes. Monkeys with lesions of the anterior inferotemporal cortex (pink), a high-order visual area, show profound deficits in working memory, declining to chance levels of performance (dashed line) on this memory test at 120 s delays. B. Monkeys with lesions of the anterior inferotemporal cortex perform like intact monkeys when required to remember 2–5 objects. Monkey with dorsal prefrontal lesions, in contrast, show profound deficits, declining to chance performance when required to remember 4 or 5 objects. Adapted from Petrides [34].
Figure 5
Figure 5
Predominance of attention coding over working-memory coding in the dorsolateral prefrontal cortex. A. Task use to distinguish attention signals from memory signals. The monkey began each trial by fixating a central spot on a video screen (dashed lines). Next, a circle appeared in one of four places: right (R), up (U), left (L), or down (D) from the fixation spot. As the monkey maintained central fixation, the circle revolved around the central spot (green arrow), coming to rest at one of those same four locations. The original location of the circle needed to be remembered because it could be the target of a future eye movement. Later, the circle either brightened or dimmed as a “go” cue, which triggered a saccadic eye movement. If it brightened (top fork), then the monkeys had to make a saccadic eye movement to fixate the remembered location (yellow arrow). In this example, the monkey had to remember the “up” location. If the circle dimmed as the “go” cue (bottom fork), then the saccade had to be made to the current location of the circle (blue arrow). The circle's current location had to be attended because its change in brightness not only instructed the monkey about which place to look next, but also when to do so. B. The activity of two neurons during the measured period, an 800-ms interval before the “go” cue. In each 4 × 4 display, the diameter of each filled circle is proportional to a neuron's firing rate for one combination of attended and remembered locations. The neuron in blue showed its greatest activity when the monkey attended to the “up” location (second column), regardless of the location stored in working memory (rows). The neuron in red showed its highest activity when the monkey remembered the R location (top row), regardless of where the monkey attended (columns). C. Most cells in the dorsolateral prefrontal cortex are like the blue one in B. Adapted from Lebedev et al. [36].
Figure 6
Figure 6
A. The strategy task of Genovesio et al. [54]. Each trial began when the monkey fixated a spot at the center of a video screen (dashed lines). Later, a cue appeared, and when it disappeared, the monkey had to make a saccadic eye movement to one of three potential goals (unfilled squares). The monkey needed to remember the cue and goal from the previous trial because if the cue repeated from that trial (called a repeat trial, top fork), then the same goal (the rightward one in this example) had to be fixated by a saccadic eye movement. If the cue changed (called a change trial, bottom fork), then the monkey had to select one of the other two goals (the leftward or upward goals in this example, with the left one illustrated). B. Neural signals reflecting the previous goal (red), the future goal (blue) and the strategy (green), when the monkeys chose the correct strategy (solid line) or the wrong one (dashed line). Note that the previous-goal signal decreased after cue onset, as the signals for the correct strategy and future goal increased. When the monkey chose the wrong strategy (dashed line), a weak or absent strategy signal occurred during the time of goal selection. B adapted from Genovesio et al. [70].

References

    1. Fulton JF. Physiology of the Nervous System. Oxford University Press; 1949.
    1. Wood JN, Grafman J. Human prefrontal cortex: Processing and representational perspectives. Nat. Rev. Neurosci. 2003;4:139–147. - PubMed
    1. Buckley MJ, Gaffan D. Perirhinal cortex ablation impairs visual object identification. J. Neurosci. 1998;18:2268–2275. - PMC - PubMed
    1. Bussey TJ, et al. Impairments in visual discrimination after perirhinal cortex lesions: testing ‘declarative’ vs. ‘perceptual-mnemonic’ views of perirhinal cortex function. Eur. J. Neurosci. 2003;17:649–660. - PubMed
    1. Murray EA, et al. Visual perception and memory: A new view of medial temporal lobe function in primates and rodents. Annu. Rev. Neurosci. 2007;30:99–122. - PubMed