. 2008 Dec 15;95(12):5661-80.
doi: 10.1529/biophysj.108.140624. Epub 2008 Oct 3.

The role of extracellular matrix in glioma invasion: a cellular Potts model approach

Affiliations

The role of extracellular matrix in glioma invasion: a cellular Potts model approach

Brenda M Rubenstein et al. Biophys J. .

Abstract

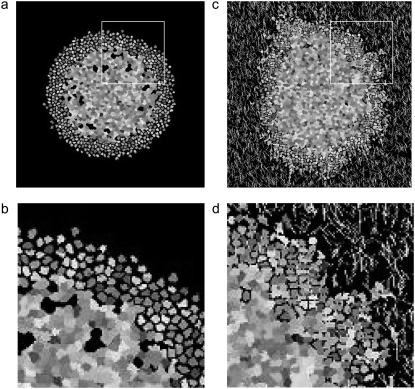
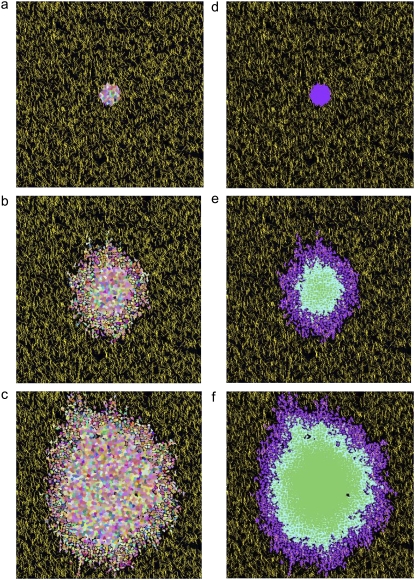
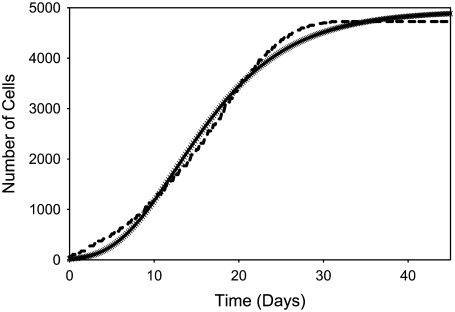
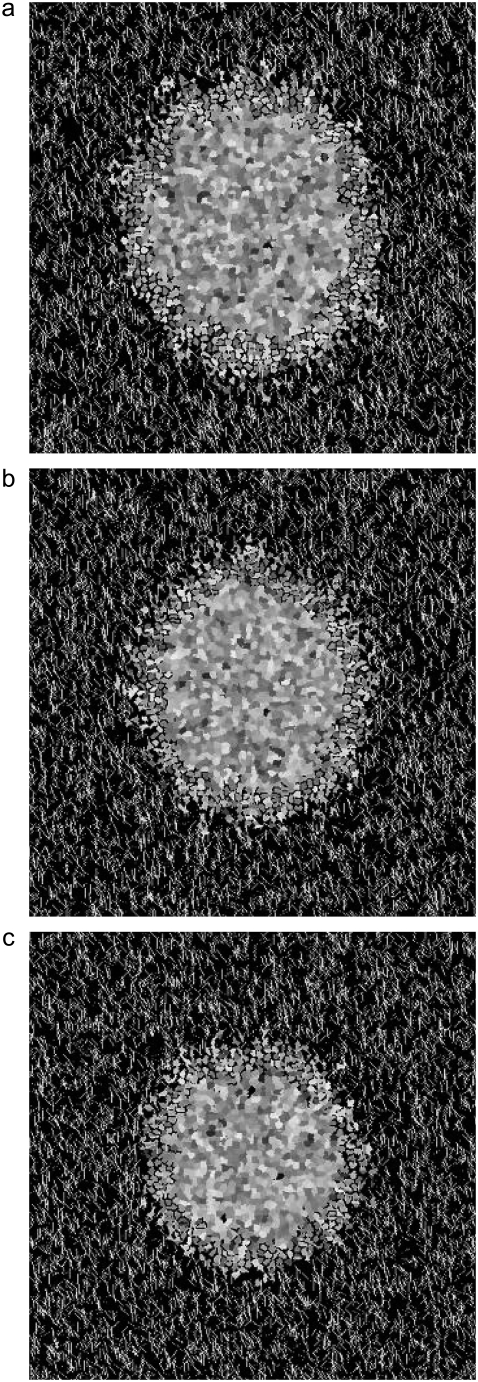
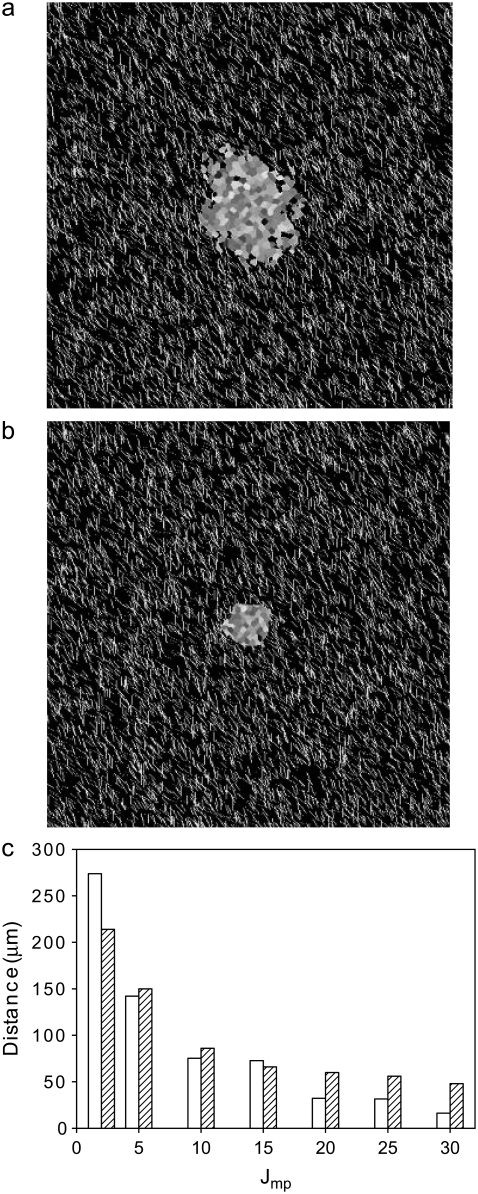
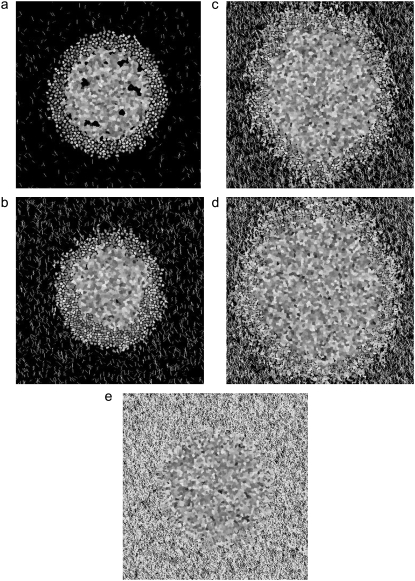
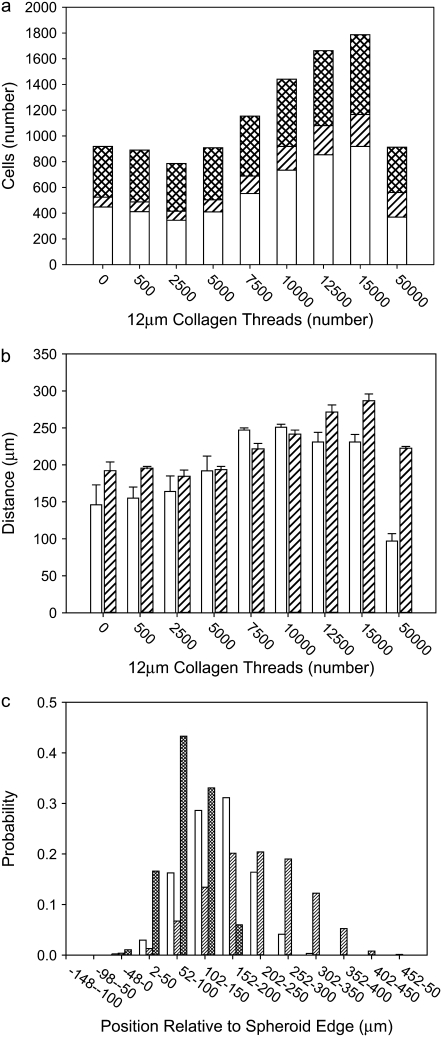
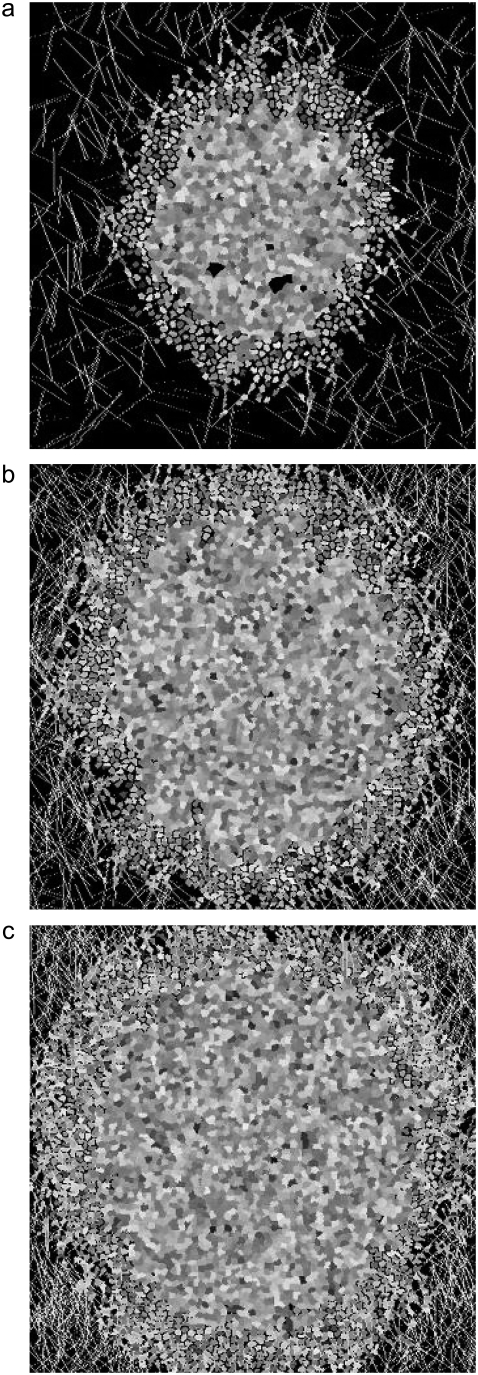
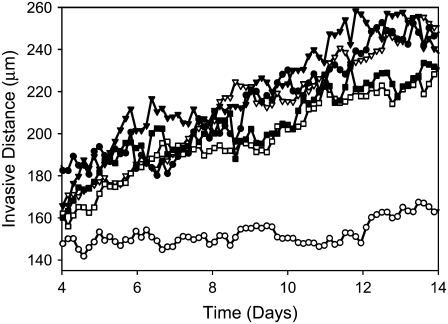
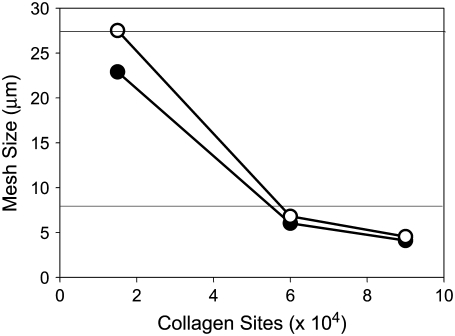
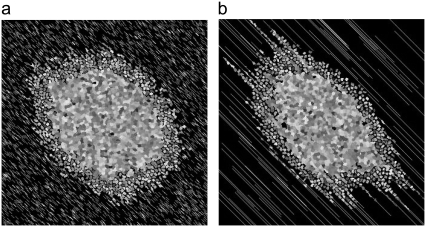
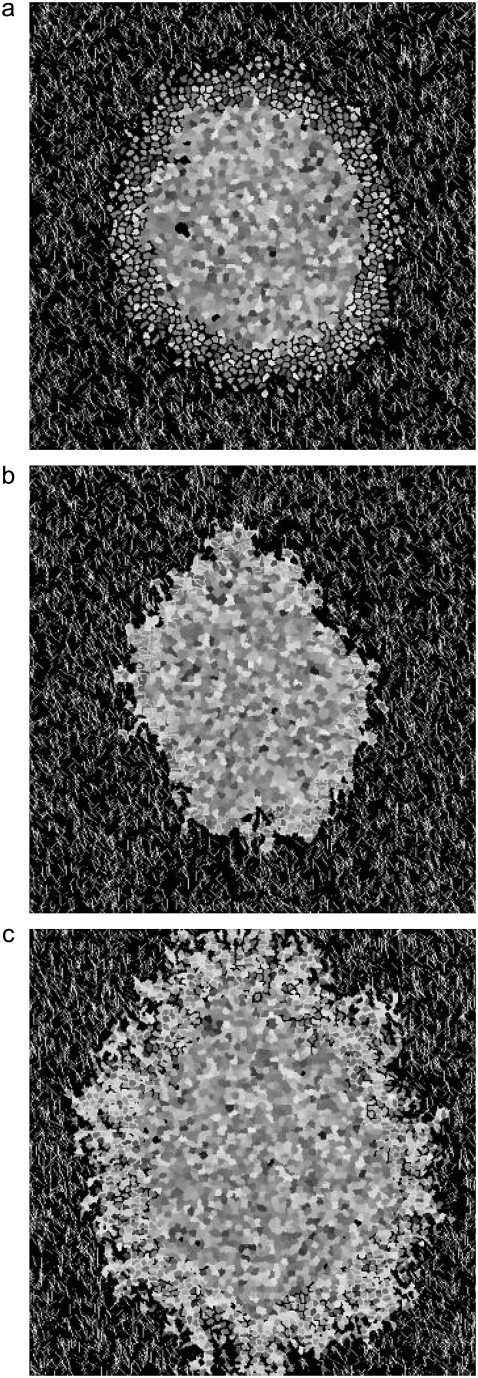
In this work, a cellular Potts model based on the differential adhesion hypothesis is employed to analyze the relative importance of select cell-cell and cell-extracellular matrix (ECM) contacts in glioma invasion. To perform these simulations, three types of cells and two ECM components are included. The inclusion of explicit ECM with an inhomogeneous fibrous component and a homogeneously dispersed afibrous component allows exploration of the importance of relative energies of cell-cell and cell-ECM contacts in a variety of environments relevant to in vitro and in vivo experimental investigations of glioma invasion. Simulations performed here focus chiefly on reproducing findings of in vitro experiments on glioma spheroids embedded in collagen I gels. For a given range and set ordering of energies associated with key cell-cell and cell-ECM interactions, our model qualitatively reproduces the dispersed glioma invasion patterns found for most glioma cell lines embedded as spheroids in collagen I gels of moderate concentration. In our model, we find that invasion is maximized at intermediate collagen concentrations, as occurs experimentally. This effect is seen more strongly in model gels composed of short collagen fibers than in those composed of long fibers, which retain significant connectivity even at low density. Additional simulations in aligned model matrices further elucidate how matrix structure dictates invasive patterns. Finally, simulations that allow invading cells to both dissolve and deposit ECM components demonstrate how Q-Potts models may be elaborated to allow active cell alteration of their surroundings. The model employed here provides a quantitative framework with which to bound the relative values of cell-cell and cell-ECM interactions and investigate how varying the magnitude and type of these interactions, as well as ECM structure, could potentially curtail glioma invasion.


Figures

FIGURE 1
FIGURE 1
Spheroids simulated according to Eqs. 6 and 9 and rules discussed in the text, with bond energies given in Table 1 at T = 4 and λ = 1. Spheroids are shown after 14 days of development. Individual cells can be differentiated, as they are depicted in grayscale. (a) Entire spheroid on a bare lattice. A number of proliferative cells have been shed into the spheroid periphery. (b) Detail of area enclosed by white box in a. (c) Entire spheroid on lattice containing 7500 12-μm threads. Many proliferative cells are invading along collagen threads, which are depicted in white. (d) Detail of area enclosed by white box in c.
FIGURE 2
FIGURE 2
Time-lapse images of the development of the spheroid shown in Fig. 1 c at 0 days (a and d), 7 days (b and e), and 14 days development (c and f). (Left) Individual cells of all cell types are depicted in different colors. Yellow, collagen; black, afibrous ECM. (Right) Cell types are depicted in different shades: purple, proliferative cells, blue, quiescent cells; and green, necrotic cells.
FIGURE 3
FIGURE 3
Regression of the growth curve (solid crosses) for the spheroid depicted in Fig. 2 against a three-parameter Gompertz equation (dashed line).
FIGURE 4
FIGURE 4
Spheroids simulated on lattices containing 7500 12-μm threads after 14 days development. All parameters are as given in Table 1, with T = 4, and elasticity, λ, varied: (a) λ = 3, (b) λ = 5, and (c) λ = 7.
FIGURE 5
FIGURE 5
Spheroid development as a function of elasticity, λ, for spheroids simulated on a lattice containing 7500 12-μm threads after 14 days development, as shown in Fig. 4. (a and b) Spheroid radius (a) and invasive distance (b), with λ = 1 (circles), λ = 3 (inverted triangles), λ = 5 (squares), and λ = 7 (diamonds). Standard deviations are plotted behind symbols and are not visible when smaller than the symbol. (c) Proliferative cell position relative to spheroid edge for one spheroid with λ = 1 (open bars) and one spheroid with λ = 7 (hatched bars).
FIGURE 6
FIGURE 6
Spheroid development as a function of temperature, T, for spheroids simulated on a lattice containing 7500 12-μm threads. (a) Total number of cells versus time for spheroids that develop at T = 2 (circles), T = 4 (inverted triangles), and T = 6 (squares). (b) Spheroid radii for T = 2 (circles), T = 4 (inverted triangles), and T = 6 (squares). (c) Proliferative cell position relative to spheroid edge for a spheroid grown with T = 2 (open bars) and T = 4 (hatched bars).
FIGURE 7
FIGURE 7
Spheroids simulated on lattices containing 7500 12-μm threads after 14 days development. All parameters are as given in Table 1, except as noted. T = 4 and λ = 1. (a) Jpp = 30. (b) Jpp = 20. (c) Jpp = 10. Necrotic, quiescent, and proliferative cells are differentiated in grayscale as in the right panel of Fig. 2 (in color).
FIGURE 8
FIGURE 8
Spheroid development as a function of proliferative cell-proliferative cell adhesion energy, Jpp, for spheroids simulated on a lattice containing 7500 12-μm threads. Measures are shown for days 4–14. Jpp = 10 (circles), Jpp = 20 (inverted triangles), and Jpp = 30 (squares). (a and b) Spheroid radius (a) and invasive distance (b) averaged over three simulations. Error bars are standard deviations and are plotted behind the symbols. (c and d) Number of proliferative cells (c) and average number of proliferative cells (d) a given proliferative cell is adjacent to for the single set of simulations shown in Fig. 7.
FIGURE 9
FIGURE 9
Spheroids simulated on lattices containing 7500 12-μm threads after 14 days development. All parameters are as given in Table 1 except as noted, and T = 4 and λ = 1. (a) Jmp = 10. (b) Jmp = 30. (c) Invasive distance (open bars) and spheroid radius (hatched bars) as a function of Jmp.
FIGURE 10
FIGURE 10
Spheroid development at 14 days as a function of number of 12-μm collagen threads, for (a) 500, (b) 2500, (c) 10,000, (d) 15,000, and (e) 50,000 threads. (Fig. 2 b shows spheroid development in a lattice of 7500 12-μm threads).
FIGURE 11
FIGURE 11
Measures of spheroid development at 14 days as a function of number of 12-μm collagen threads. (a) Number of cells: proliferative cells (open), quiescent cells (hatched), and necrotic cells (solid). Means are given for three simulations. (b) Invasive distance (open) and spheroid radius (hatched). Means and standard deviations are reported for three simulations. (c) Proliferative cell position relative to spheroid edge for 2500 (open), 15000 (hatched), and 50,000 (cross-hatched) 12-μm collagen threads for the simulations that give rise to the spheroid images in Fig. 10.
FIGURE 12
FIGURE 12
Spheroid development at 14 days as a function of number of 52-μm collagen threads, for (a) 577, (b) 2308, and (c) 3462 threads. Number of collagen sites is identical to those of Fig. 10, bd, respectively.
FIGURE 13
FIGURE 13
Invasive distance for spheroids that develop in lattices of 15,000 (circles), 60,000 (inverted triangles), and 90,000 (squares) collagen sites. Open symbols depict invasive distance for lattices with 12-μm threads and solid symbols depict those for lattices with 52-μm threads. Only the spheroid grown on the low-concentration lattice populated by short threads exhibits a significantly smaller invasive radius.
FIGURE 14
FIGURE 14
Mesh size versus number of collagen sites for 12-μm (open circles) and 52-μm (solid circles) threads. Horizontal lines are drawn at mesh sizes of experimental matrices of 0.5- and 2.0-mg/ml collagen I gels as described in Kaufman et al. (16).
FIGURE 15
FIGURE 15
Spheroid development at 14 days on aligned collagen matrices composed of (a) 12-μm and (b) 202-μm collagen threads.
FIGURE 16
FIGURE 16
Spheroid development at 14 days allowing (a) matrix dissolution 50% of the time, (b) matrix deposition 50% of the time, and (c) both matrix dissolution and deposition 50% of the time, as described in the text.

References

    1. Surawicz, T. S., F. Davis, S. Freels, E. R. Laws Jr., and H. R. Menck. 1998. Brain tumor survival: results from the National Cancer Data Base. J Neurooncol. 40:151–160. - PubMed
    1. Central Brain Tumor Registry of the United States (CBTRUS). 2002–2003. Statistical Report Primary Brain Tumors in the United States, 1995–1999. CBTRUS, Chicago.
    1. Weaver, V. M., O. W. Petersen, F. Wang, C. A. Larabell, P. Briand, C. Damsky, and M. J. Bissell. 1997. Reversion of the malignant phenotype of human breast cells in three-dimensional culture and in vivo by integrin blocking antibodies. J. Cell Biol. 137:231–245. - PMC - PubMed
    1. Friedl, P., and E. B. Brocker. 2000. The biology of cell locomotion within three-dimensional extracellular matrix. Cell. Mol. Life Sci. 57:41–64. - PMC - PubMed
    1. Cukierman, E., R. Pankov, D. R. Stevens, and K. M. Yamada. 2001. Taking cell-matrix adhesions to the third dimension. Science. 294:1708–1712. - PubMed

LinkOut - more resources