

Behavioral differences between phosphatidic acid and phosphatidylcholine in the presence of the nicotinic acetylcholine receptor
- PMID: 18835908
- PMCID: PMC2599862
- DOI: 10.1529/biophysj.108.136895
Behavioral differences between phosphatidic acid and phosphatidylcholine in the presence of the nicotinic acetylcholine receptor
Abstract
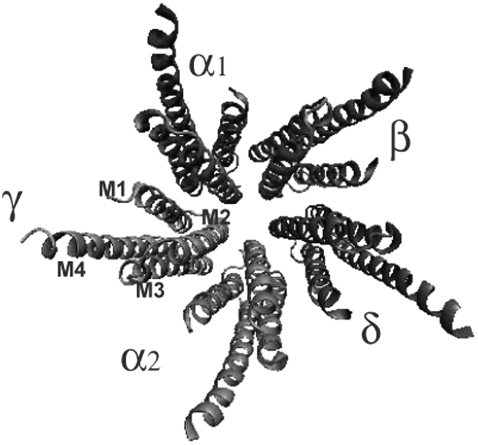
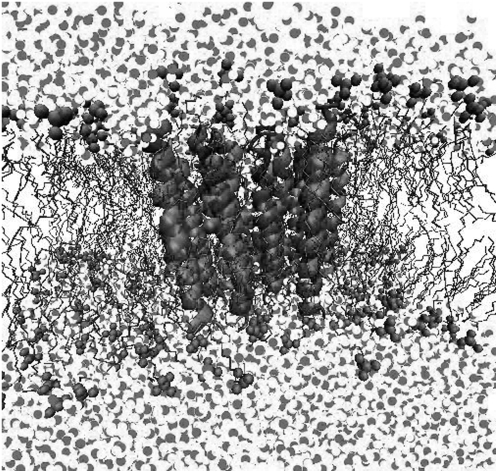
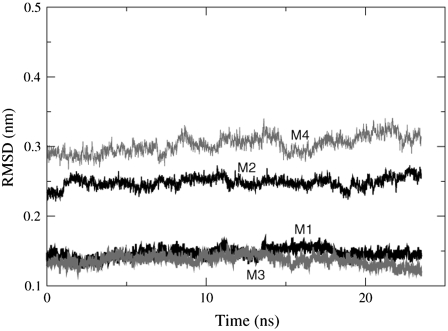
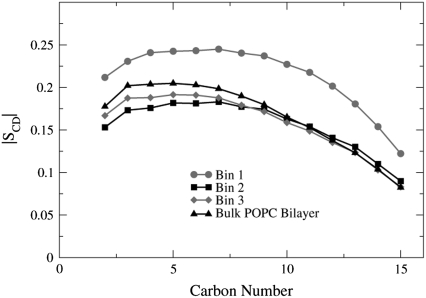
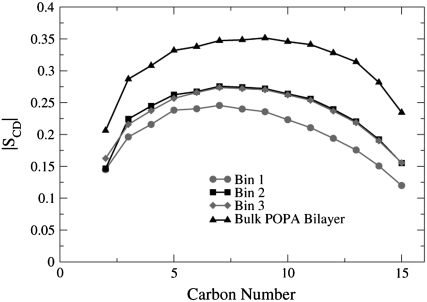
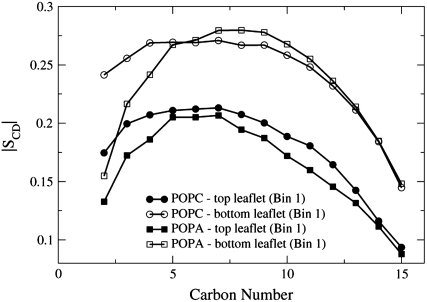
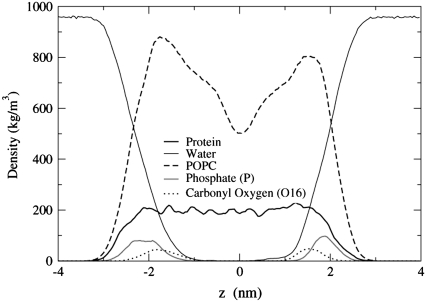
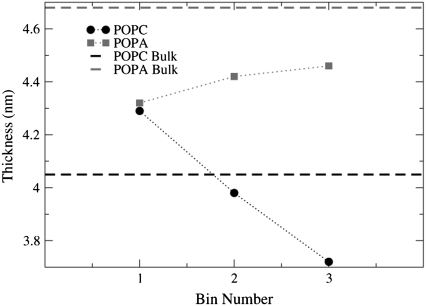
It has been found experimentally that negatively charged phosphatidic acid (PA) lipids and cholesterol molecules stabilize the nicotinic acetylcholine receptor (nAChR) in a functional resting state that can participate in an agonist-induced conformational change. In this study, we compare phosphatidylcholine (PC) and PA lipid behavior in the presence of the nAChR to determine why PC lipids do not support a functional nAChR. For lipids that are located within 1.0 nm of the protein, both PC and PA lipids have very similar order-parameter and bilayer-thickness values, which indicate that the annular lipid properties are protein-dependent. The most significant difference between the PC and PA bilayers is the formation of a lipid domain around the protein, which is visible in the PA bilayer but not the PC bilayer. This suggests that the PA domain may help stabilize the nAChR resting state. The PA lipids in the microdomain have a decreased order compared to a homogeneous PA bilayer and the lipids near the protein attempt to increase the free space in their vicinity by residing in multiple lateral planes.
Figures
Similar articles
-
Phosphatidic acid and phosphatidylserine have distinct structural and functional interactions with the nicotinic acetylcholine receptor.J Biol Chem. 2004 Apr 9;279(15):14967-74. doi: 10.1074/jbc.M310037200. Epub 2004 Jan 29. J Biol Chem. 2004. PMID: 14752108
-
Lipid composition alters drug action at the nicotinic acetylcholine receptor.Mol Pharmacol. 2008 Mar;73(3):880-90. doi: 10.1124/mol.107.039008. Epub 2007 Nov 30. Mol Pharmacol. 2008. PMID: 18055762
-
Molecular dynamics simulations of ternary membrane mixture: phosphatidylcholine, phosphatidic acid, and cholesterol.J Phys Chem B. 2007 Dec 27;111(51):14186-92. doi: 10.1021/jp075467b. Epub 2007 Dec 5. J Phys Chem B. 2007. PMID: 18052271 Free PMC article.
-
Nicotinic acetylcholine receptor-lipid interactions: Mechanistic insight and biological function.Biochim Biophys Acta. 2015 Sep;1848(9):1806-17. doi: 10.1016/j.bbamem.2015.03.010. Epub 2015 Mar 16. Biochim Biophys Acta. 2015. PMID: 25791350 Review.
-
Fluorescence Studies of Nicotinic Acetylcholine Receptor and Its Associated Lipid Milieu: The Influence of Erwin London's Methodological Approaches.J Membr Biol. 2022 Oct;255(4-5):563-574. doi: 10.1007/s00232-022-00239-9. Epub 2022 May 9. J Membr Biol. 2022. PMID: 35534578 Review.
Cited by
-
Characterization of Lipid-Protein Interactions and Lipid-Mediated Modulation of Membrane Protein Function through Molecular Simulation.Chem Rev. 2019 May 8;119(9):6086-6161. doi: 10.1021/acs.chemrev.8b00608. Epub 2019 Apr 12. Chem Rev. 2019. PMID: 30978005 Free PMC article. Review.
-
Extracting curvature preferences of lipids assembled in flat bilayers shows possible kinetic windows for genesis of bilayer asymmetry and domain formation in biological membranes.J Membr Biol. 2013 Jul;246(7):557-70. doi: 10.1007/s00232-013-9568-1. Epub 2013 Jun 22. J Membr Biol. 2013. PMID: 23793773
-
Alzheimer's Disease as a Membrane Disorder: Spatial Cross-Talk Among Beta-Amyloid Peptides, Nicotinic Acetylcholine Receptors and Lipid Rafts.Front Cell Neurosci. 2019 Jul 18;13:309. doi: 10.3389/fncel.2019.00309. eCollection 2019. Front Cell Neurosci. 2019. PMID: 31379503 Free PMC article. Review.
-
Probing the lipid-protein interface using model transmembrane peptides with a covalently linked acyl chain.Biophys J. 2011 Oct 19;101(8):1959-67. doi: 10.1016/j.bpj.2011.09.020. Biophys J. 2011. PMID: 22004750 Free PMC article.
-
Anionic lipid and cholesterol interactions with alpha4beta2 nAChR: insights from MD simulations.J Phys Chem B. 2009 May 14;113(19):6964-70. doi: 10.1021/jp900714b. J Phys Chem B. 2009. PMID: 19419220 Free PMC article.
References
-
- Unwin, N. 2005. Refined structure of the nicotinic acetylcholine receptor at 4 Å resolution. J. Mol. Biol. 346:967–989. - PubMed
-
- Lee, A. G. 2004. How lipids affect the activities of integral membrane proteins. Biochim. Biophys. Acta. 1666:62–87. - PubMed
-
- Jones, O. T., and M. G. McNamee. 1988. Annular and nonannular binding sites for cholesterol associated with the nicotinic acetylcholine receptor. Biochemistry. 27:2364–2374. - PubMed
-
- Fong, T. M., and M. G. McNamee. 1986. Correlation between acetylcholine receptor function and structural properties of membranes. Biochemistry. 25:830–840. - PubMed
-
- Lee, A. G. 2003. Lipid-protein interactions in biological membranes: a structural perspective. Biochim. Biophys. Acta. 1612:1–40. - PubMed
Publication types
MeSH terms
Substances
Grants and funding
LinkOut - more resources
Full Text Sources
