Comparative Study
. 2008 Nov;18(11):1763-77.
doi: 10.1101/gr.080622.108. Epub 2008 Oct 3.

E2F in vivo binding specificity: comparison of consensus versus nonconsensus binding sites

Affiliations
Comparative Study

E2F in vivo binding specificity: comparison of consensus versus nonconsensus binding sites

Alina Rabinovich et al. Genome Res. 2008 Nov.

Abstract

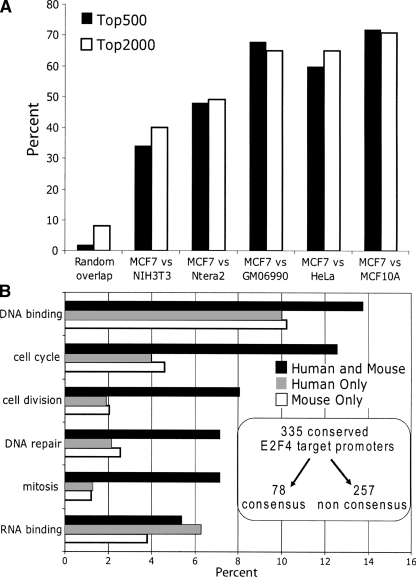
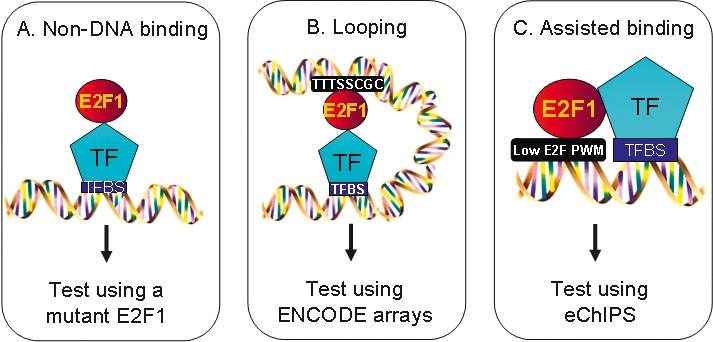
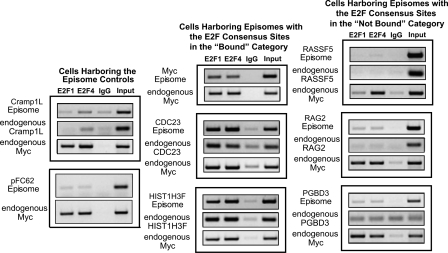
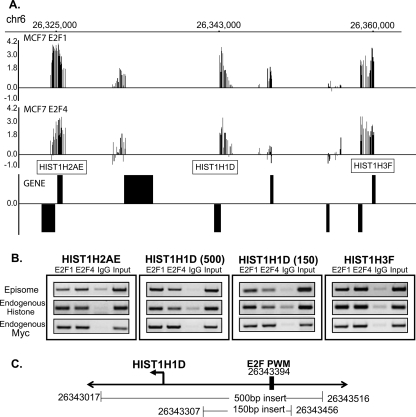
We have previously shown that most sites bound by E2F family members in vivo do not contain E2F consensus motifs. However, differences between in vivo target sites that contain or lack a consensus E2F motif have not been explored. To understand how E2F binding specificity is achieved in vivo, we have addressed how E2F family members are recruited to core promoter regions that lack a consensus motif and are excluded from other regions that contain a consensus motif. Using chromatin immunoprecipitation coupled with DNA microarray analysis (ChIP-chip) assays, we have shown that the predominant factors specifying whether E2F is recruited to an in vivo binding site are (1) the site must be in a core promoter and (2) the region must be utilized as a promoter in that cell type. We have tested three models for recruitment of E2F to core promoters lacking a consensus site, including (1) indirect recruitment, (2) looping to the core promoter mediated by an E2F bound to a distal motif, and (3) assisted binding of E2F to a site that weakly resembles an E2F motif. To test these models, we developed a new in vivo assay, termed eChIP, which allows analysis of transcription factor binding to isolated fragments. Our findings suggest that in vivo (1) a consensus motif is not sufficient to recruit E2Fs, (2) E2Fs can bind to isolated regions that lack a consensus motif, and (3) binding can require regions other than the best match to the E2F motif.


Figures

Figure 1.
Figure 1.
Most E2F1 binding regions do not contain a consensus E2F motif. Using E2F1 ChIP-chip data from two biologically independent cultures of MCF7 cells (Xu et al. 2007), we called peaks for each of the ∼24,100 1.5-kb promoter regions. We ranked the promoters by the enrichment values (E2F1 IP vs. Input) of the peaks and then binned the promoters into ranked sets of 100 (x-axis). The ratio of promoters in each bin that contain a consensus E2F site is indicated on the y-axis. For comparison, the approximate location of the bin containing the CCNA1 promoter, a well-characterized E2F target, is shown.
Figure 2.
Figure 2.
Characterization of the promoters that contain E2F consensus motifs but are not bound by E2F1 in MCF7 cells. The set of 1566 consensus E2F1 motifs that were unoccupied by E2F1 in MCF7 cells was compared with the top 2000 targets identified in ChIP-chip assays for E2F4, E2F6, H3me3K7, H3me3K9, and 5-meC (Xu et al. 2007; Komashko et al. 2008). The percentage of promoters in the “unoccupied E2F motif” set that was bound by E2F4 or E2F6, which was found in silenced chromatin (but not bound by E2F4 or E2F6), or was in silenced chromatin and bound by E2F4 or E2F6 is shown. The number of the 1566 promoters bound by the various combinations of silencing marks and E2Fs are shown in Supplemental Table S4. For comparison, the overlap between the silencing marks and a set of 1566 randomly chosen promoters is shown in Supplemental Figure S1.
Figure 3.
Figure 3.
Characterization of unbound E2F consensus motifs in ENCODE regions. (A) The overlap of the 116 experimentally determined E2F4 sites and the 507 consensus E2F motifs in the ENCODE regions are shown. (B) The percentage of occupied vs. unoccupied consensus E2F motifs that are located within 2 kb of the start site of a known gene are shown. (C) Shown are the percentages of unoccupied E2F consensus motifs in the ENCODE regions that are within the regions identified to be bound by H3me3K27, H3me3K9, and 5-MeC. (D) Shown is a region of chromosome 19, along with the binding pattern of E2F4, H3me3K27, H3me3K9, and 5-MeC and the location of the consensus E2F motifs and start codons.
Figure 4.
Figure 4.
Human and mouse E2F4 target promoters have similar characteristics. (A) ChIP-chip assays for E2F4 mouse 3T3 cells were performed and peaks were called for each of the ∼24,000 1.5-kb mouse promoter regions. E2F4 ChIP-chip data from MCF7 cells (Xu et al. 2007) was also analyzed for comparison. We ranked the promoters by the enrichment values (E2F4 IP vs. Input) of the peaks and then binned the promoters into ranked sets of 100 (x-axis). The ratio of promoters in each bin that contain a consensus E2F motif is indicated on the y-axis. (B). Functional annotations were performed using the program Database for Annotation, Visualization, and Integrated Discovery (DAVID) 2007 (Dennis et al. 2003; see also http://niaid.abcc.ncifcrf.gov/). The categories used were InterPro name and SP PIR Keywords. The top categories are shown for the sets human and mouse E2F4 target promoters, derived from the promoters that were in the top 2000 list in duplicate mouse or human ChIP-chip experiments. The x-axis indicates the percentage of each set represented by the different categories; see Supplemental Table S3A for the P-values for each category.
Figure 5.
Figure 5.
Conserved E2F4 targets are more highly enriched in classical E2F target gene categories, but are not enriched in consensus E2F motifs. (A) The percentage of promoters that were identified in either the top 500 or top 2000 sets of ranked promoters from both the mouse 3T3 and human MCF7 E2F4 ChIP-chip experiments was determined. For comparison, the percentage expected by random chance and the percentage overlap of E2F4 targets from MCF7 cells with E2F4 targets from four other human cell lines is also shown. (B) Functional annotations were performed as described in Figure 4. The top categories are shown for the sets of E2F4 target promoters identified only in the duplicate human E2F4 MCF7 ChIP-chip experiments (794 promoters), only in the duplicate E2F4 3T3ChIP-chip experiments (977 promoters), or in all four human and mouse E2F4 ChIP-chip experiments (335 promoters). The x-axis indicates the percentage of each set represented by the different categories; see Supplemental Table S3B for the P-values for each category. Shown in the inset is the number of the human and mouse conserved E2F4 target promoters that contain or lack a consensus E2F motif.
Figure 6.
Figure 6.
Models for recruitment of E2F1 to promoters that lack a consensus motif. Shown are schematics representing potential modes of E2F1 recruitment via a mechanism independent of its DNA binding domain (A), via looping (B), or via stabilized binding in cooperation with another transcription factor (C).
Figure 7.
Figure 7.
Establishment of the eChIP assay. (Left) Analysis of E2F1 and E2F4 ChIP samples in cells harboring the episomal negative controls: the empty episomal vector (left, bottom) and an episome containing a portion of the transcribed region of CRAMP1L (left, top). (Middle) Binding of E2F1 and E2F4 to episomes containing a 500-bp fragment of the MYC, CDC23, or HIST1H3F promoters, all of which possess a consensus E2F motif and were previously shown to be bound by E2Fs in the ChIP-chip experiments. (Right) Binding of E2F1 and E2F4 to episomes containing a 500-bp fragment of the RASSF5, RAG2, or PGBD3 promoters, all of which possess a consensus E2F motif, but were previously shown not to be bound by E2Fs in the ChIP-chip experiments. For all experiments, IgG was used as a negative control antibody and binding to the endogenous MYC promoter was analyzed as a positive control for E2F enrichment. Furthermore, the binding of E2F1 and E2F4 to the corresponding endogenous promoters was analyzed in all of the eChIP samples.
Figure 8.
Figure 8.
Analysis of the chromosome 6 histone cluster using eChIP assays. (A) The binding pattern of E2F1 and E2F4 in MCF7 cells to a portion of the histone cluster on chromosome 6 is shown. (B) Binding of E2F1 and E2F4 to 500-bp regions of the HIST1H2AE, HIST1H3F, and HIST1H1D promoters, as well as to a 150-bp region of the HIST1H1D promoter, is shown. The binding of E2F1 and E2F4 to the endogenous histone promoters and to the endogenous MYC promoter (as a positive control for the ChIP samples) was also analyzed. (C) A schematic of the hg17 chromosomal coordinates of the 500- and 150-bp constructs of the HIST1H1D promoter is shown; the location of the best match to E2F positional weight matrix (PWM) within the cloned in region is also indicated.
Figure 9.
Figure 9.
Delineation of the E2F recruitment site at the TIMELESS promoter. (A) Binding of E2F1 and E2F4 to various fragments of the TIMELESS promoter is shown. The binding of E2F1 and E2F4 to the endogenous TIMELESS promoter and to the endogenous MYC promoter was also analyzed in the same samples as positive controls. (B) A schematic of the hg17 chromosomal coordinates of the tested fragments of the TIMELESS promoter is shown; the location of the best match to the E2F positional weight matrix (PWM) within the cloned in region is also indicated.

References

    1. Acevedo L.G., Iniguez A.L., Holster H.L., Zhang X., Green R., Farnham P.J. Genome-scale ChIP-chip analysis using 10,000 human cells. Biotechniques. 2007;43:791–797. - PMC - PubMed
    1. Acevedo L.G., Bieda M., Green R., Farnham P.J. Analysis of the mechanisms mediating tumor-specific changes in gene expression in human liver tumors. Cancer Res. 2008;68:2641–2651. - PMC - PubMed
    1. Bandara L.R., Buck V.M., Zamanian M., Johnston L.H., La Thangue N.B. Functional synergy between DP-1 and E2F-1 in the cell cycle-regulating transcription factor DRTF1/E2F. EMBO J. 1993;12:4317–4324. - PMC - PubMed
    1. Barski A., Cuddapah S., Cui K., Roh T.Y., Schones D.E., Wang Z., Wei G., Chepelev I., Zhao K. High-resolution profiling of histone methylations in the human genome. Cell. 2007;129:823–837. - PubMed
    1. Bernstein B.E., Meissner A., Lander E.S. The mammalian epigenome. Cell. 2007;128:669–681. - PubMed

Publication types

MeSH terms