

Performance of confocal scanning laser tomograph Topographic Change Analysis (TCA) for assessing glaucomatous progression
- PMID: 18836168
- PMCID: PMC2778474
- DOI: 10.1167/iovs.08-2136
Performance of confocal scanning laser tomograph Topographic Change Analysis (TCA) for assessing glaucomatous progression
Abstract
Purpose: To determine the sensitivity and specificity of confocal scanning laser ophthalmoscope's Topographic Change Analysis (TCA; Heidelberg Retina Tomograph [HRT]; Heidelberg Engineering, Heidelberg, Germany) parameters for discriminating between progressing glaucomatous and stable healthy eyes.
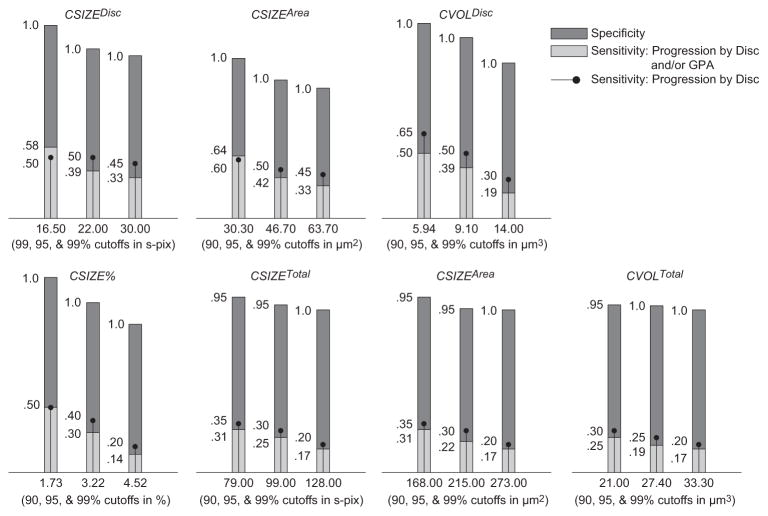
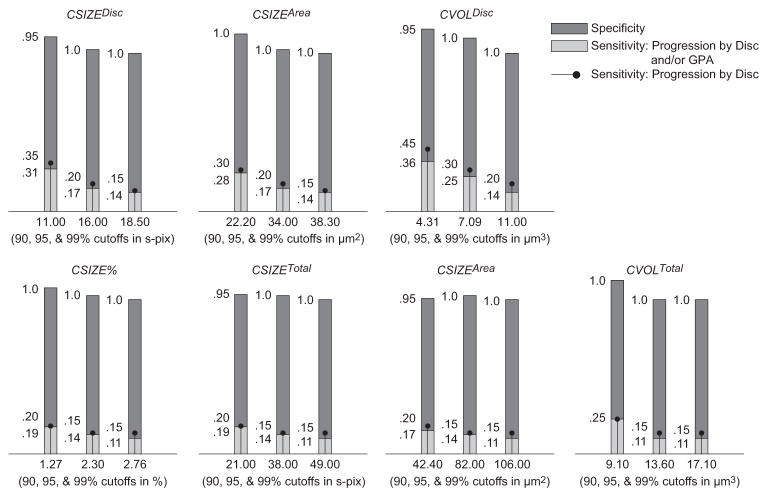
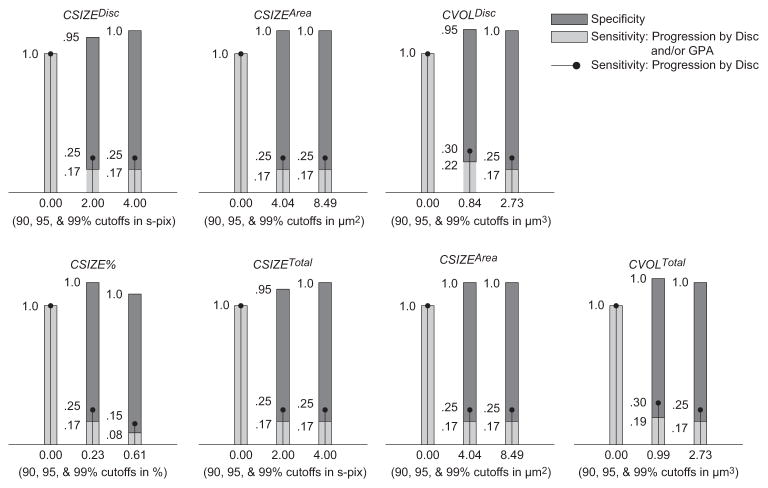
Methods: The 0.90, 0.95, and 0.99 specificity cutoffs for various (n=70) TCA parameters were developed by using 1000 permuted topographic series derived from HRT images of 18 healthy eyes from Moorfields Eye Hospital, imaged at least four times. The cutoffs were then applied to topographic series from 36 eyes with known glaucomatous progression (by optic disc stereophotograph assessment and/or standard automated perimetry guided progression analysis, [GPA]) and 21 healthy eyes from the University of California, San Diego (UCSD) Diagnostic Innovations in Glaucoma Study (DIGS), all imaged at least four times, to determine TCA sensitivity and specificity. Cutoffs also were applied to 210 DIGS patients' eyes imaged at least four times with no evidence of progression (nonprogressed) by stereophotography or GPA.
Results: The TCA parameter providing the best sensitivity/specificity tradeoff using the 0.90, 0.95, and 0.99 cutoffs was the largest clustered superpixel area within the optic disc margin (CAREA(disc) mm(2)). Sensitivities/specificities for classifying progressing (by stereophotography and/or GPA) and healthy eyes were 0.778/0.809, 0.639/0.857, and 0.611/1.00, respectively. In nonprogressing eyes, specificities were 0.464, 0.570, and 0.647 (i.e., lower than in the healthy eyes). In addition, TCA parameter measurements of nonprogressing eyes were similar to those of progressing eyes.
Conclusions: TCA parameters can discriminate between progressing and longitudinally observed healthy eyes. Low specificity in apparently nonprogressing patients' eyes suggests early progression detection using TCA.
Figures
References
-
- Zangwill L, Medeiros F, Bowd C, Weinreb R. Optic nerve imaging: recent advances. In: Grehn F, Stamper R, editors. Glaucoma. Berlin: Springer-Verlag; 2004. pp. 63–91.
-
- Strouthidis N, Garway-Heath D. New developments in Heidelberg Retina Tomograph for glaucoma. Curr Opin Ophthalmol. 2008;19:141–148. - PubMed
-
- Repka MX, Quigley HA. The effect of age on normal human optic nerve fiber number and diameter. Ophthalmology. 1989;96:26–32. - PubMed
-
- Jonas JB, Muller-Bergh JA, Schlotzer-Schrehardt UM, Naumann GO. Histomorphometry of the human optic nerve. Invest Ophthalmol Vis Sci. 1990;31:736–744. - PubMed
Publication types
MeSH terms
Grants and funding
LinkOut - more resources
Full Text Sources
Medical
