. 2008 Nov;10(11):1280-90.
doi: 10.1038/ncb1786. Epub 2008 Oct 5.

Epigenetic restriction of embryonic cell lineage fate by methylation of Elf5

Affiliations

Epigenetic restriction of embryonic cell lineage fate by methylation of Elf5

Ray Kit Ng et al. Nat Cell Biol. 2008 Nov.

Abstract

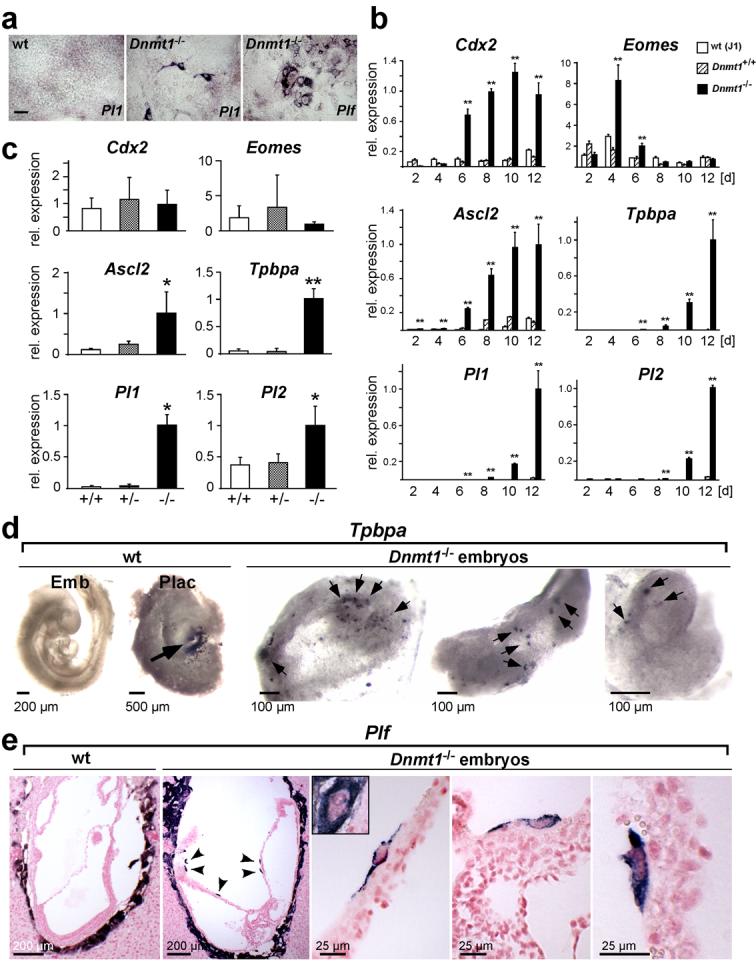
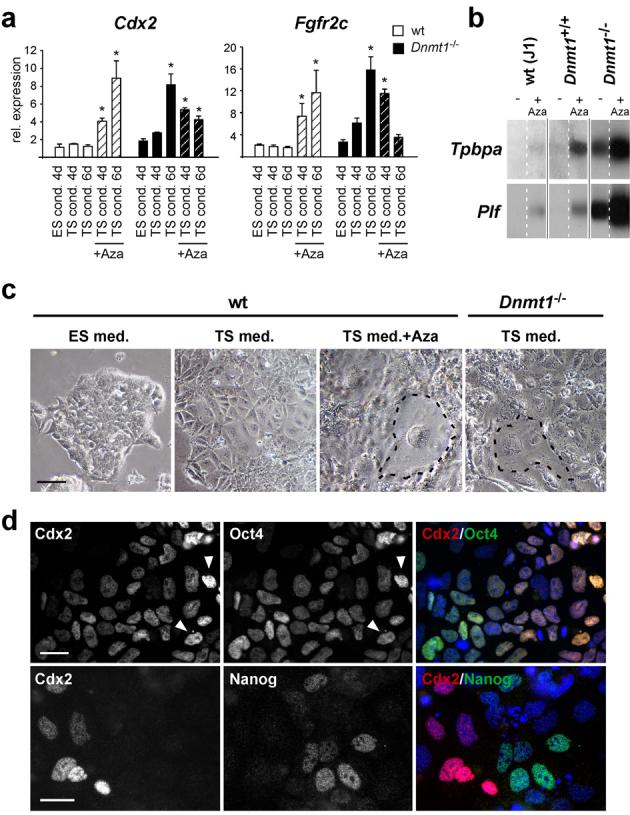
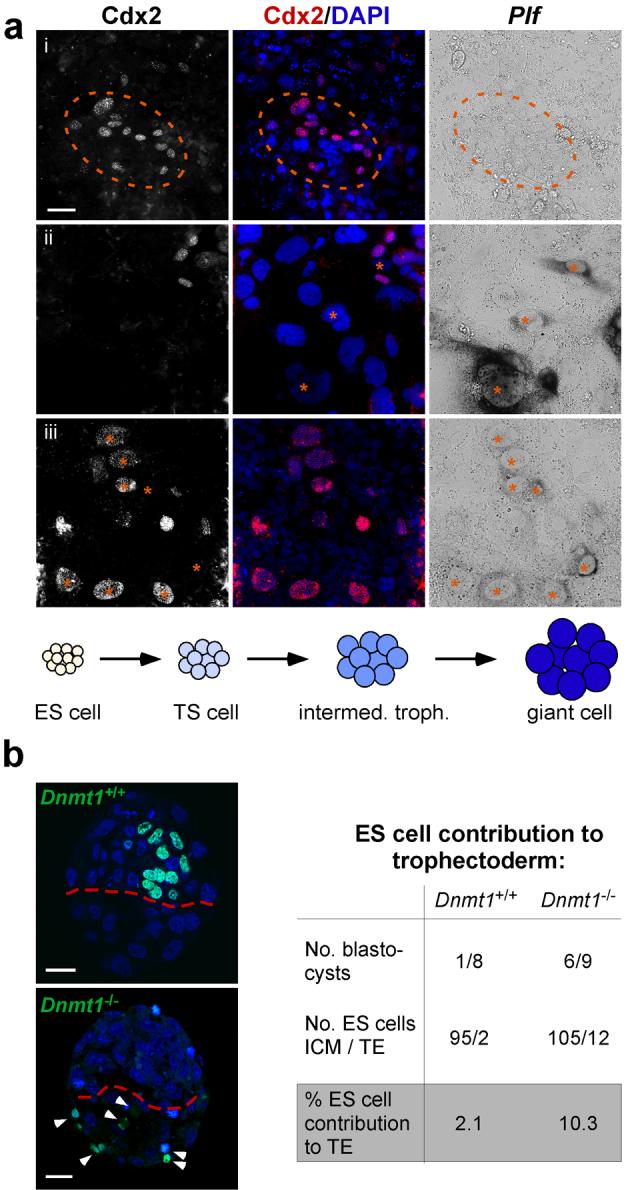
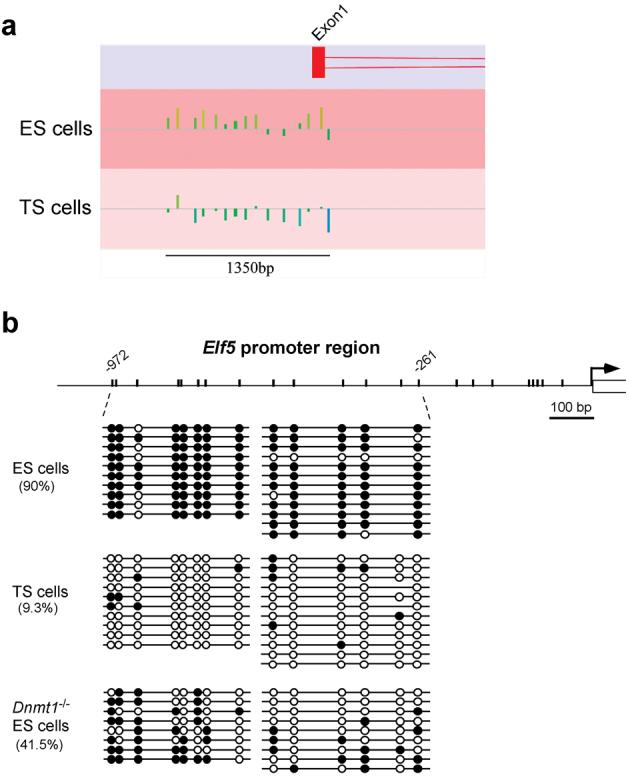
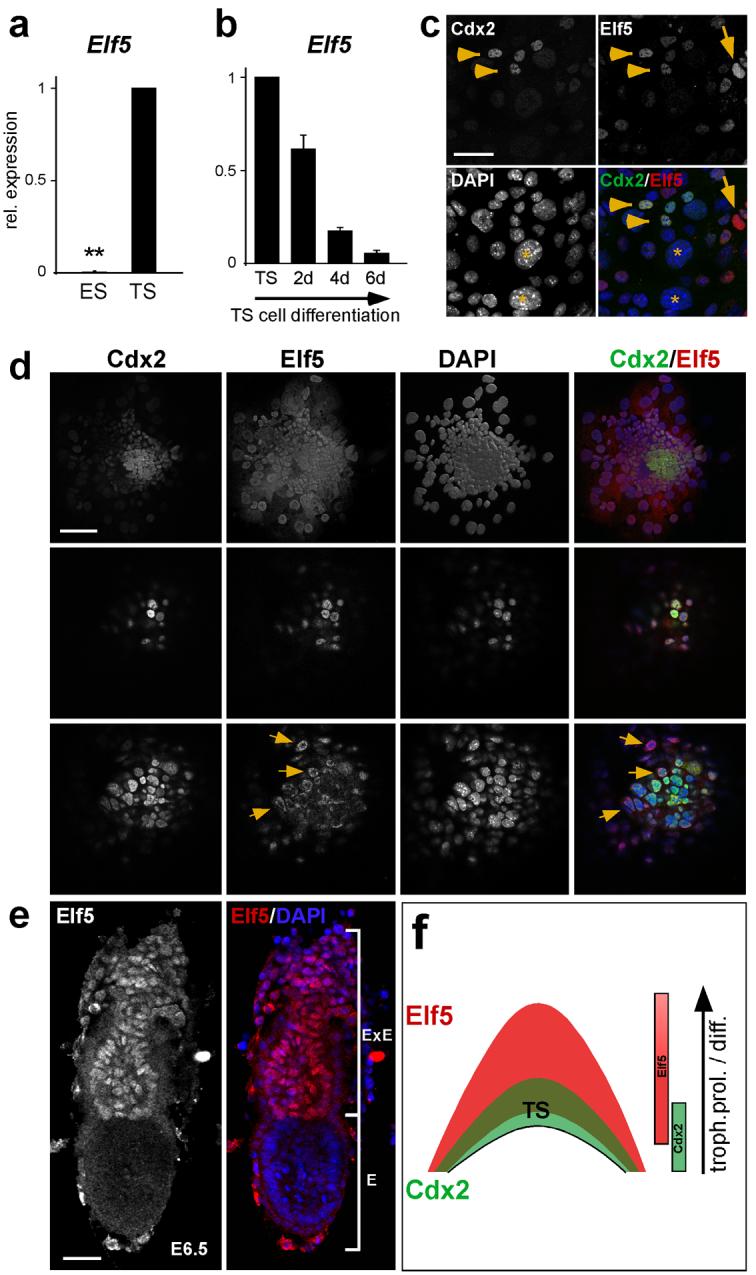
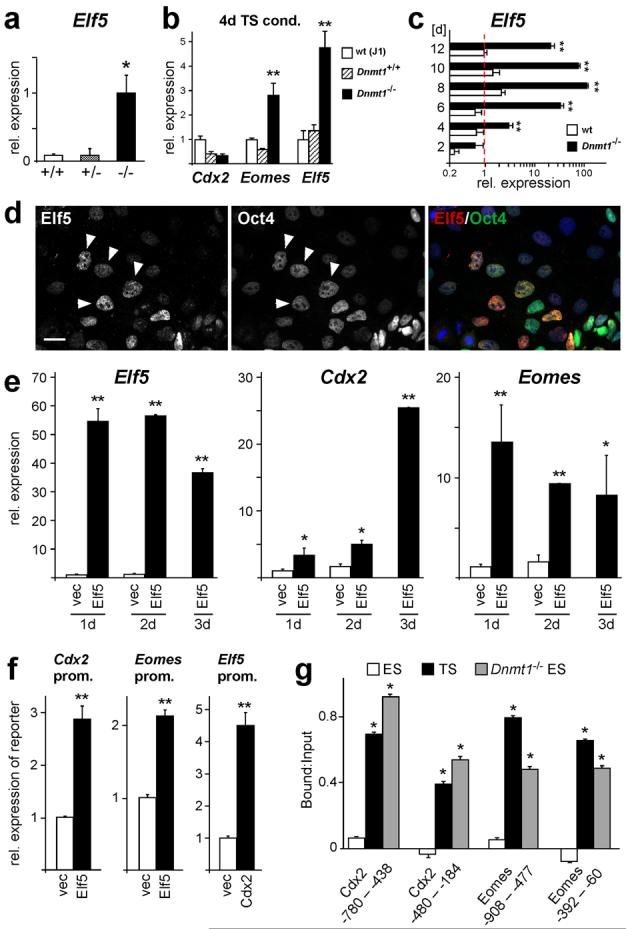
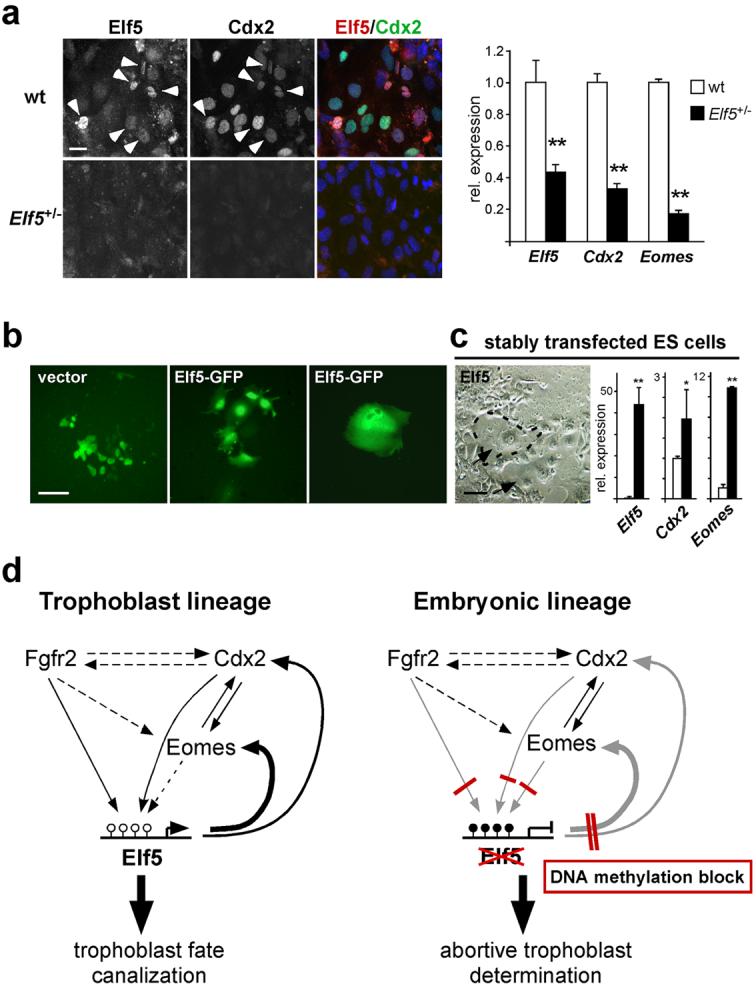
Mouse ES cells can differentiate into all three germ layers of the embryo but are generally excluded from the trophoblast lineage. Here we show that ES cells deficient in DNA methylation can differentiate efficiently into trophoblast derivatives. In a genome-wide screen we identified the transcription factor Elf5 as methylated and repressed in ES cells, and hypomethylated and expressed in TS and methylation-deficient ES cells. Elf5 creates a positive-feedback loop with the TS cell determinants Cdx2 and Eomes that is restricted to the trophoblast lineage by epigenetic regulation of Elf5. Importantly, the late-acting function of Elf5 allows initial plasticity and regulation in the early blastocyst. Thus, Elf5 functions as a gatekeeper, downstream of initial lineage determination, to reinforce commitment to the trophoblast lineage or to abort this pathway in epiblast cells. This epigenetic restriction of cell lineage fate provides a molecular mechanism for Waddington's concept of canalization of developmental pathways.


Figures

Fig. 1
Fig. 1
Dnmt1-deficiency enables trophoblast differentiation from cells committed to the embryonic cell lineage. (a) Trophoblast giant cells differentiate from Dnmt1-/- ES cells, but not wildtype (wt) ES cells, in vitro when cultured in TS cell conditions. In situ hybridization with trophoblast giant cell-specific markers Pl1 (after 12d) and Plf (after 8d). (b) Time course of trophoblast marker activation in ES cells upon culture in TS cell medium for 2-12 days. Significant expression levels are only observed in Dnmt1-deficient ES cells (data are mean ± s.d., **P<0.005; n=3). Trophoblast stem cell markers (Cdx2, Eomes) are the first to be up-regulated, followed by intermediate diploid trophoblast markers Ascl2 and Tpbpa, and trophoblast giant cell markers Pl1 and Pl2. (c) Quantitative RT-PCR analysis of trophoblast markers on E9.5 embryos from Dnmt1+/- intercrosses. Trophoblast-restricted genes Ascl2, Tpbpa, Pl1 and Pl2 are detected at significant levels only in Dnmt1-/- embryos (data are mean ± s.d., *P<0.05, **P<0.005; n=7). (d) Whole mount in situ hybridization with the trophoblast marker Tpbpa on E9.5 Dnmt1-/- embryos and littermate control (wt) embryos and placentas. Positive staining (dark purple-black) is seen in the ectoplacental cone/spongiotrophoblast area (arrow) of the placenta (Plac). No staining is observed in the wt embryo (Emb). In Dnmt1-/- embryos, numerous Tpbpa-positive cells are present (arrows). (e)In situ hybridization with the giant cell marker Plf on E8.5 wildtype (wt) and Dnmt1-deficient conceptuses. Arrowheads point towards Plf-positive cells (blue-purple) that are observed within embryonic structures in Dnmt1-/- conceptuses only. Higher magnification views show the morphology of these cells; they are larger than surrounding cells but do not reach the size of parietal trophoblast giant cells (shown in inset). Scale bar in a represents 100 μm, scale bars in d and e are as indicated.
Fig. 2
Fig. 2
Trophoblast differentiation is induced in wildtype ES cells upon inhibition of DNA methylation and is independent of Oct4 down-regulation. (a) Expression levels of Cdx2 and Fgfr2c in wildtype and Dnmt1-/- ES cells cultured in ES-, TS- and TS cell medium with 5-azacytidine over the indicated time periods. Culture in TS cell medium alone is sufficient to induce expression of Cdx2 and Fgfr2c from Dnmt1-/- ES cells, but expression levels of these trophoblast stem cell markers cannot be further enhanced by 5-azacytidine treatment. In wildtype ES cells, Cdx2 and Fgfr2c expression can be induced by inhibition of DNA methylation with 5-azacytidine. Data are mean ± s.d., *P<0.05; n=3. (b) Northern blot hybridization with Tpbpa and Plf on wildtype (J1 and Dnmt1+/+) and Dnmt1-/- ES cells after 12d culture in TS cell medium in the presence (+ Aza) or absence (-) of 5-azacytidine. 5-azacytidine treatment induces differentiation of trophoblast derivatives in wildtype ES cells and further enhances the amount of differentiated trophoblast subtypes from Dnmt1-/- ES cells. The separated lanes are parts of the same original blot; full scans of blots are provided in Supplemental Information, Fig. S5. (c) Wildtype and Dnmt1-/- ES cells grown for 4-6 days under the indicated conditions. Wildtype ES cells cultured in TS cell conditions undergo differentiation into embryonic lineage derivatives, but rarely form trophoblast giant cells. Trophoblast-like morphology and the appearance of giant cells (encircled) are evident in wildtype ES cells treated with 5-azacytidine and in Dnmt1-/- ES cells cultured in TS cell conditions. (d) Double immunofluorescence labelling of Dnmt1-/- ES cells grown for 6 days in TS cell conditions for Oct4 (Pou5f1), Nanog and Cdx2. Trophoblast differentiation is not triggered by down-regulation of Oct4. Arrows point to cells expressing high amounts of both Cdx2 and Oct4. A more reciprocal expression pattern is observed for Nanog and Cdx2. Scale bar in c represents 100 μm, scale bars in d represent 25 μm.
Fig. 3
Fig. 3
Dnmt1-/- ES cells transdifferentiate into functional trophoblast derivatives. (a) Double labelling of Dnmt1-/- ES cells grown in TS cell conditions for 6 days and stained by in situ hybridization for the giant cell marker Plf and by immunofluorescence for the TS cell marker Cdx2. Cdx2-positive cells are observed in small groups consisting on average of 5-15 cells. At this early time point of transdifferentiation, giant cells (Plf) are either absent (i) or emerging in direct vicinity to Cdx2-positive TS cell clusters (ii). On rare occasions, cells can be captured at an intermediate stage of concomitant low Cdx2 and Plf expression (iii; marked with asterisks), demonstrating that giant cells differentiate from pre-existing trophoblast stem cells. Thus, trophoblast differentiation from Dnmt1-/- ES cells proceeds via a trophoblast stem cell stage from which other trophoblast subtypes differentiate sequentially, recapitulating the differentiation steps within the trophoblast lineage proper (graph). (b) Blastocysts derived from aggregation of wildtype embryos with H2B-GFP labelled Dnmt1+/+ or Dnmt1-/- ES cells that were pre-conditioned in TS cell medium. Dnmt1-/- ES cells differentiate into functional trophoblast and exhibit a 5-fold increased efficacy to contribute to trophectoderm. Arrowheads point to individual GFP-positive Dnmt1-/- cells within the mural trophoectoderm. Scale bar in a represents 20 μm, scale bars in b represent 25 μm.
Fig. 4
Fig. 4
Global promoter methylation screen identifies Elf5 as the key gene that is methylated in ES cells and unmethylated in TS cells. (a) meDIP chip screen reveals strikingly differential methylation at the Elf5 promoter. ChipMonk profile of the Elf5 upstream region in ES and TS cells. The line represents the median signal intensity of the array; vertical bars above indicate relative hypermethylation and vertical bars below hypomethylation at individual oligonucleotide probes. (b) Bisulphite analysis of the 1 kb promoter region of Elf5 in ES, TS, and Dnmt1-/- ES cells. The promoter is almost fully DNA methylated (filled circles) in ES cells, but largely hypomethylated (open circles) in TS cells. Dnmt1-/- ES cells exhibit intermediate DNA methylation levels. Note that the CpG site at position -355 bp is polymorphic.
Fig.5
Fig.5
Elf5 is a trophoblast stem cell transcription factor specific to proliferative trophoblast. (a)Elf5 is not expressed in ES cells but exhibits high expression levels in TS cells (Data are mean ± s.d., **P=1.12E-12; n=3). (b)Elf5 expression is specific to the stem cell state of TS cells and is down-regulated upon differentiation of TS cells. (c) Double immunofluorescence staining for Elf5 and Cdx2 on cultured TS cells shows co-localization of both transcription factors in most stem cells (arrowheads). Some diploid trophoblast cells only express Elf5 (arrow), while giant cell nuclei are mostly negative for both factors (asterisks). (d) Characterization of Elf5 expression in blastocyst outgrowths. Selected confocal section planes are shown. Compared to Cdx2, Elf5 marks a larger population of trophoblast cells (top row). A few central cells only express Cdx2, followed by a core of double positive trophoblast stem cells (middle row). Elf5 staining extends beyond this core into surrounding trophoblast cells (bottom row). Nuclear localization adopts a cortical distribution where diploid trophoblast starts to differentiate into giant cells (arrows). Giant cells are devoid of nuclear Elf5. (e) Whole mount staining of an E6.5 embryo for Elf5. Elf5 expression is strictly trophoblast lineage-specific and is confined to the extraembryonic ectoderm (where trophoblast stem cells are located) and to the ectoplacental cone. E=embryonic portion, ExE=extraembryonic portion. (f) Schematic diagram representing the temporal and spatial distribution of Cdx2 and Elf5. A small Cdx2+ population is overlaid by a Cdx2+ Elf+ trophoblast stem cell core. Elf5 extends from there into the surrounding diploid trophoblast population that undergoes proliferation (prol.) and differentiation (diff.) at the margins of the ectoplacental cone. Scale bar in c represents 50 μm, scale bars in d and e represent 100 μm.
Fig. 6
Fig. 6
Epigenetically controlled Elf5 expression acts in a positive feedback loop to reinforce trophoblast identity. (a)Elf5 expression is strongly induced in Dnmt1-/- embryos, but not in wildtype and heterozygous littermate embryos (data are mean ± s.d., *P=0.026; n≥6). (b)Elf5 is the earliest, most strongly activated trophoblast marker in Dnmt1-/- ES cells cultured for 4 days in TS cell conditions (data are mean ± s.d., **P=0.00185 [Eomes] and P=0.00051 [Elf5]; n=3). (c)Elf5 expression is further enhanced in Dnmt1-deficient ES cells during the following days of culture in TS cell conditions (data are mean ± s.d., **P<0.005; n=3). (d) Double labelling of Dnmt1-/- ES cells grown for 4 days in TS cell conditions for Elf5 and Oct4. Oct4 repression is not required for activation of Elf5. (e)Elf5 expression in wildtype ES cells causes activation of TS cell markers Cdx2 and Eomes. Wildtype ES cells were transfected with an Elf5-GFP expression construct, FACS sorted and assessed by qRT-PCR. The construct confers high levels of Elf5 expression to transfected cells (Elf5) compared to control transfected cells (vec) that do not express Elf5. Elf5 induces high expression of Eomes. Cdx2 expression is significantly elevated after 1 and 2 days (>3-fold), and reaches highest activation levels after 3 days of Elf5 transfection (data are mean ± s.d., *P<0.05, **P<0.005; n=3). (f)Elf5, Cdx2, or empty vector control, were co-transfected with 2 kb Cdx2, Eomes or Elf5 promoter-reporter constructs. Expression of the reporter gene was analyzed by qRT-PCR 24 hours after transfection. Elf5 can induce both Cdx2 and Eomes promoters. Cdx2 can activate the Elf5 promoter (data are mean ± s.d., **P<0.005; n=3). (g) Chromatin immunoprecipitation assays with an anti-Elf5 antibody. Elf5 binds directly to the Cdx2 and Eomes promoters in TS cells and 3-day transdifferentiated Dnmt1-/- ES cells, but not in wildtype ES cells. Values are represented as Bound:Input and normalized against mock control (data are mean ± s.d., *P<0.05; n=3). Scale bar in d represents 25 μm.
Fig. 7
Fig. 7
Gatekeeper function of Elf5 in cell lineage specification. (a) Initiation of the trophoblast differentiation cascade depends on Elf5. ES cells heterozygous for a gene-trap insertion at the Elf5 locus grown for 5 days in TS medium with 5-azacytidine and assessed for Elf5, Cdx2 and Eomes expression. The gene-trap insertion reduces Elf5 mRNA levels to 44% and further reduces protein levels. Elf5 and Cdx2 staining is abundant in wild-type ES cells (arrowheads); almost no Elf5 immunostaining is detected in Elf5+/- cells. Low Elf5 expression is associated with a dramatic decrease in Cdx2 protein and Cdx2 and Eomes mRNA levels. Images were taken at identical exposure settings; qRT-PCR data are mean ± s.d., **P<0.005; n=3. (b) Wildtype ES cells transfected with Elf5-GFP or empty vector were FACS sorted and re-plated in TS cell medium for 4 days. Control cells proliferate and form colonies; Elf5-transfected cells cease to proliferate and differentiate into trophoblast giant cells. (c) Wildtype ES cells stably transfected with a Cre-inducible Elf5 expression construct were transfected with Cre-GFP, FACS-sorted, and re-plated in TS cell medium for 5 days. Elf5 expression leads to trophoblast differentiation and appearance of trophoblast giant cell clusters (arrows, examples encircled). White and black bars represent cells before and after Cre-mediated Elf5 induction, respectively (data are mean ± s.d., *P<0.05, **P<0.005; n=3). (d) Model of Elf5 function in lineage canalization. Developmental onset of expression and genetic data place Elf5 downstream of Cdx2, Eomes and Fgfr2. The developmental position of Elf5 coincides with the definitive fixation of cell lineage fate at the late blastocyst stage. Elf5 is regulated by DNA methylation, but the upstream players Cdx2, Eomes and Fgfr2 are not. Elf5 creates an essential feedback loop to reinforce Cdx2 and Eomes expression in trophoblast stem cells. Epigenetic silencing of Elf5 by DNA methylation interrupts this trophoblast-specific reinforcement loop in the embryonic lineage, and thereby safeguards embryonic cells from differentiating into trophoblast derivatives. Scale bar in a represents 25 μm, scale bar in b and c represents 100 μm.

References

    1. Gardner RL. Clonal analysis of early mammalian development. Philos Trans R Soc Lond B Biol Sci. 1985;312:163–78. - PubMed
    1. Dyce J, George M, Goodall H, Fleming TP. Do trophectoderm and inner cell mass cells in the mouse blastocyst maintain discrete lineages? Development. 1987;100:685–98. - PubMed
    1. Fleming TP. A quantitative analysis of cell allocation to trophectoderm and inner cell mass in the mouse blastocyst. Dev Biol. 1987;119:520–31. - PubMed
    1. Johnson MH, McConnell JM. Lineage allocation and cell polarity during mouse embryogenesis. Semin Cell Dev Biol. 2004;15:583–97. - PubMed
    1. Bradley A, Robertson E. Embryo-derived stem cells: a tool for elucidating the developmental genetics of the mouse. Curr Top Dev Biol. 1986;20:357–71. - PubMed

Publication types

MeSH terms