. 2008 Nov;11(11):1352-60.
doi: 10.1038/nn.2202. Epub 2008 Oct 5.

A neural code for three-dimensional object shape in macaque inferotemporal cortex

Affiliations

A neural code for three-dimensional object shape in macaque inferotemporal cortex

Yukako Yamane et al. Nat Neurosci. 2008 Nov.

Abstract

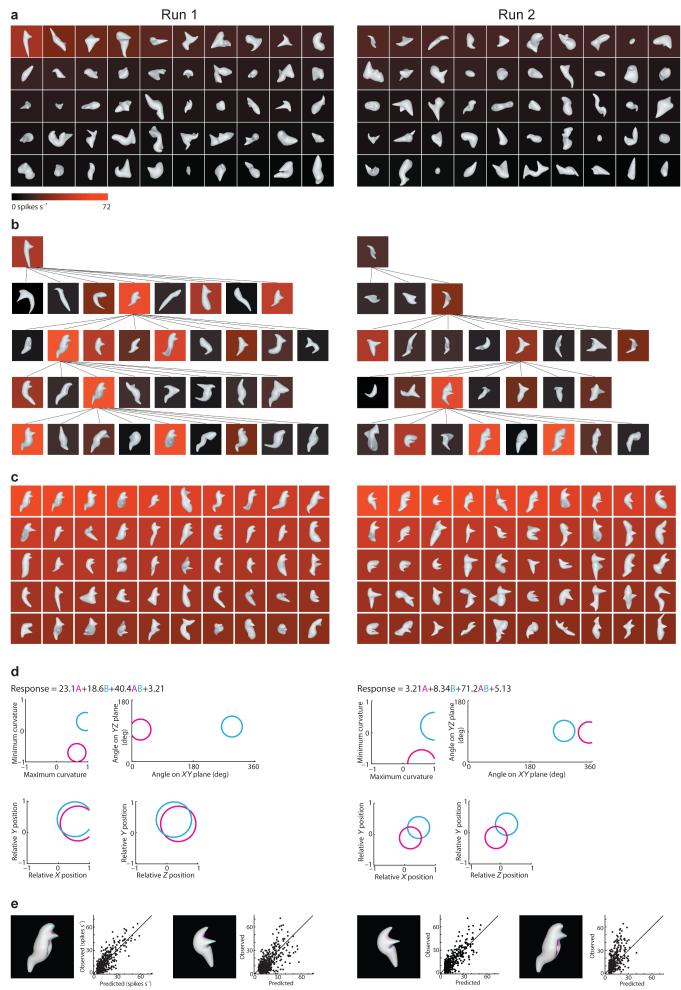
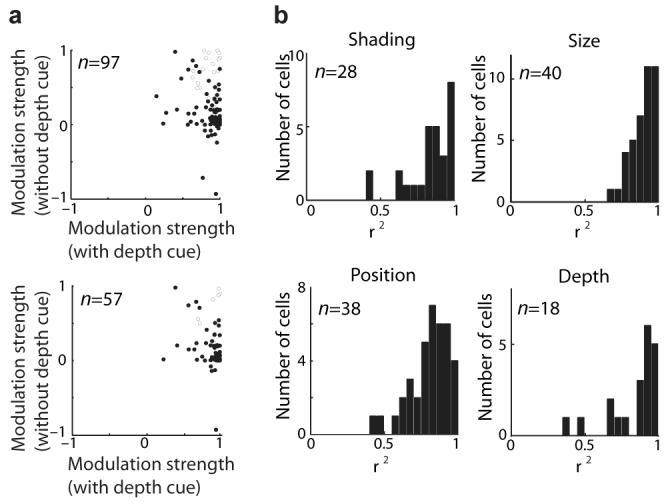
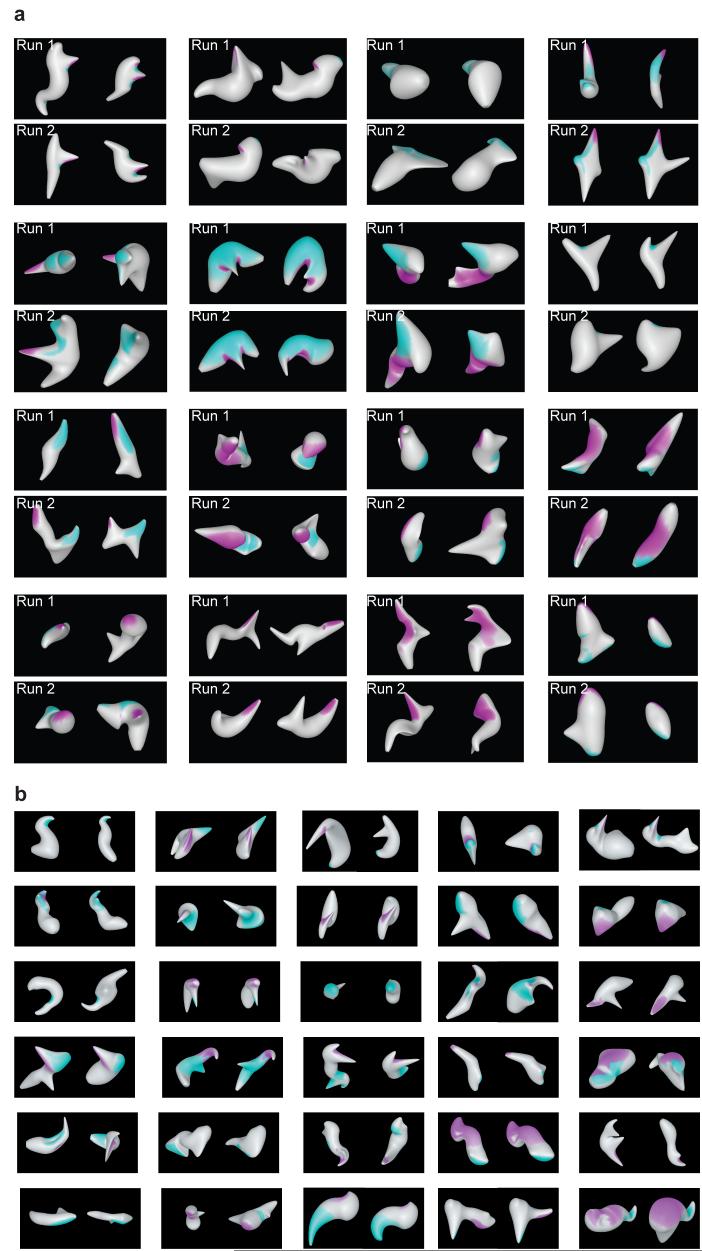
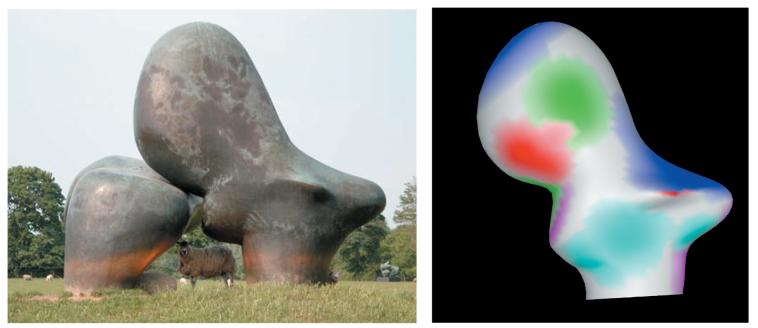
Previous investigations of the neural code for complex object shape have focused on two-dimensional pattern representation. This may be the primary mode for object vision given its simplicity and direct relation to the retinal image. In contrast, three-dimensional shape representation requires higher-dimensional coding derived from extensive computation. We found evidence for an explicit neural code for complex three-dimensional object shape. We used an evolutionary stimulus strategy and linear/nonlinear response models to characterize three-dimensional shape responses in macaque monkey inferotemporal cortex (IT). We found widespread tuning for three-dimensional spatial configurations of surface fragments characterized by their three-dimensional orientations and joint principal curvatures. Configural representation of three-dimensional shape could provide specific knowledge of object structure to support guidance of complex physical interactions and evaluation of object functionality and utility.


Figures

Figure 1
Figure 1. Evolutionary 3D shape experiment
Two independent stimulus lineages (Run 1 and Run 2) are shown in the left and right columns respectively. Background color (see scale bar) indicates the average response to each stimulus of a single IT neuron recorded from the ventral bank of the superior temporal sulcus (6.45 mm anterior to the interaural line). (a) Initial generations of 50 randomly constructed 3D shape stimuli. Stimuli are ordered from top left to bottom right according to average response strength. (b) Partial family trees showing how stimulus shape and response strength evolved across successive generations. (c) Highest response stimuli across 10 generations (500 stimuli) in each lineage. (d) Linear/nonlinear response models based on two Gaussian tuning functions. The Gaussian functions describe tuning for surface fragment geometry, defined in terms of curvature (principal, i.e. maximum and minimum, cross-sectional curvatures), orientation (of a surface normal vector, projected onto the x/y and y/z planes), and position (relative to object center of mass in x/y/z coordinates). The curvature scale is squashed to a range between –1 and 1 (see Methods). The 1.0 standard deviation boundaries of the two Gaussians (magenta and cyan) are shown projected onto different combinations of these dimensions. These boundaries appear circular because standard deviations in the curvature, orientation, and position dimensions were constrained (respectively) to have the same values in order to limit model complexity. The equations show the overall response models, with fitted weights for the two Gaussians, the product or interaction term, and the baseline response. (e) The two Gaussian functions are shown projected onto the surface of a high response stimulus from each run. The stimulus surface is tinted according to the tuning amplitude in the corresponding region of the model domain. In this and subsequent displays, the projection areas are extended to include strongly correlated surface regions (see Methods). The scatterplots show the relationship between observed responses and responses predicted by the model. In each case, self-prediction by the model is illustrated by the stimulus/scatterplot pair on the left and cross-prediction by the pair on the right.
Figure 2
Figure 2. Neural tuning for 3D configuration of surface fragments
Error bars indicate s.e.m. (a) Top 50 stimuli across 8 generations (400 stimuli) for a single IT neuron recorded from the ventral bank of the superior temporal sulcus (17.5 mm anterior to the interaural line). (b) Bottom 50 stimuli for the same cell. (c) Responses to highly effective (top), moderately effective (middle) and ineffective (bottom) example stimuli as a function of depth cues (shading, disparity, and texture gradients, exemplified in Supplementary Fig. 10 online). Responses remained strong as long as disparity (black, green, blue) or shading (gray) cues were present. The cell did not respond to stimuli with only texture cues (pale green) or silhouettes with no depth cues (pale blue). (d) Response consistency across lighting direction. The implicit direction of a point source at infinity was varied across 180° in the horizontal (left to right, black curve) and vertical (below to above, green curve) directions, creating very different 2D shading patterns (Supplementary Fig. 11). (e) Response consistency across stereoscopic depth. In the main experiment, the depth of each stimulus was adjusted so that the disparity of the surface point at fixation was 0 (i.e. the animal was fixating in depth on the object surface). In this test, the disparity of this surface point was varied from −4.5° (near) to 5.6° (far). (f) Response consistency across x/y position. Position was varied in increments of 4.5° of visual angle across a range of 13.5° in both directions. (g) Sensitivity to stimulus orientation. Like all neurons in our sample, this cell was highly sensitive to stimulus orientation, although it showed broad tolerance (about 90°) to rotation about the z axis (rotation in the image plane, blue curve); this rotation tolerance is also apparent among the top 50 stimuli in (a). Rotation out of the image plane, about the x axis (black) or y axis (green) strongly suppressed responses. (h) Response consistency across object size over a range from half to twice the original stimulus. (i) Linear/nonlinear response model based on two Gaussian tuning functions. Details as in Fig. 2d,e. (j) The tuning functions are projected onto the surface of a high response stimulus, seen from the observer’s viewpoint (left) and from above (right).
Figure 3
Figure 3. Prevalence of 3D shape tuning in IT
(a) Response modulation depended strongly on 3D cues for the majority of neurons in our sample. For each cell, three stimuli (with high, medium, and low responses in the evolutionary test) were presented with depth cues (disparity and shading) and without (solid color silhouette stimuli with the same boundary shape). A separate modulation index (difference between maximum and minimum responses, normalized by maximum response across the entire test) was calculated for the with- and without-depth cue conditions. The modulation index is the response difference between the high- and low-response stimuli, normalized by maximum response across all conditions. This normalization ensures that high values reflect robust responses. In some cases, removing 3D cues reversed the rank order of responses and produced negative index values. The average modulation index of 0.85 with depth cues (horizontal axis) dropped to 0.26 without depth cues. The effect of depth cues on responses was significant (P < 0.05) for 76/97 cells (filled circles) based on two-way ANOVA (main or interaction effects of stereo and shading). Of the 95 cells with significant 3D shape tuning models, 57 were tested in this way. For these cells, the modulation index average dropped from 0.87 with depth cues to 0.23 without, and the 49/57 cells showed significant main or interaction ANOVA effects. (b) Shape tuning was independent of shading pattern, stereoscopic depth, stimulus position and stimulus size. Response consistency across these factors was tested as shown in Fig. 2. Response consistency was measured by separability of tuning for shape (across the high, medium, and low response stimuli) and tuning for shading, depth, position, or size. Separability is represented here by the fraction of response variance (r2) explainable by a matrix product between separate tuning functions for shape and shading/depth/position/size. These tuning functions were the first pair of singular vectors in a singular value decomposition of the observed tuning matrix. For each factor, most neurons have r2 values above 0.75, showing that 3D shape tuning is largely independent of lighting direction, stimulus position, stimulus size, and stimulus depth.
Figure 4
Figure 4. 3D surface configuration tuning patterns
(a) All neurons for which two independent evolutionary stimulus lineages were obtained. In each case, two high response stimuli are shown from the first run (top row) and the second run (bottom row). Best fit 2-component models are projected onto these stimuli as in Fig. 1e. (b) Example neurons for which only one lineage was obtained. In each case, two high response stimuli are shown with the best fit model projected onto the surface.
Figure 5
Figure 5. Distribution of 3D shape tuning
(a) Comparison distribution of surface point positions in the y/z plane (relative to object center of mass) in random stimuli (1st generation stimuli for all 95 neurons described here). The scale is in arbitrary units approximately corresponding to stimulus size (maximum span in any direction averaged across stimuli = 1.08). (b) Distribution of Gaussian tuning peaks in best-fit models for 95 neurons. The stimulus distribution peak is shown in the surface plot (asterisk) and the stimulus distributions are shown in the marginal histograms (red curves). The distribution is biased toward positive values in the z dimension, i.e. positions in front of object center. (c) Comparison distribution of surface curvatures across random (1st generation) stimuli. The bias toward positive (convex) curvatures is characteristic of closed, topologically spherical surfaces. (d) Distribution of Gaussian tuning peaks in the curvature domain. The stimulus distribution peak is shown in the surface plot (asterisk) and the stimulus distributions are shown in the marginal histograms (red curves). Relative to the stimulus distribution, the tuning peaks are biased toward higher magnitude convexity in the maximum curvature dimension and higher magnitude concavity in the minimum curvature dimension.
Figure 6
Figure 6. Configural coding of 3D object structure
To illustrate how complex 3D shape could be encoded at the population level, five 2-Gaussian tuning models (red, green, blue, cyan, magenta) from our neural sample are projected onto a 3D rendering (right) of the larger figure in Henry Moore’s “Sheep Piece” (1971-72, left; reproduced by permission of the Henry Moore Foundation, www.henry-moore-fdn.co.uk). (Tuning models were scaled and rotated to optimize correspondence.) A small number of neurons representing surface fragment configurations would uniquely specify an arbitrary 3D shape of this kind and would carry the structural information required for judging its physical properties, functionality (or lack thereof), and aesthetic value.

Comment in

  • So many pixels, so little time.
    Mazer JA. Mazer JA. Nat Neurosci. 2008 Nov;11(11):1243-4. doi: 10.1038/nn1108-1243. Nat Neurosci. 2008. PMID: 18956009 No abstract available.

References

    1. Ungerleider LG, Mishkin M. In: Analysis of Visual Behavior. Ingle DG, Goodale MA, Mansfield RJQ, editors. MIT Press; Cambridge, Massachusetts: 1982. pp. 549–586.
    1. Felleman DJ, Van Essen DC. Distributed hierarchical processing in the primate cerebral cortex. Cereb. Cortex. 1991;1:1–47. - PubMed
    1. Anzai A, Peng X, Van Essen DC. Neurons in monkey visual area V2 encode combinations of orientations. Nat. Neurosci. 2007;10:1313–1321. - PubMed
    1. Ito M, Komatsu H. Representation of angles embedded within contour stimuli in area V2 of macaque monkeys. J. Neurosci. 2004;24:3313–3324. - PMC - PubMed
    1. Gallant JL, Braun J, Van Essen DC. Selectivity for polar, hyperbolic, and Cartesian gratings in macaque visual cortex. Science. 1993;259:100–103. - PubMed

Publication types