. 2008 Nov;5(11):935-8.
doi: 10.1038/nmeth.1256. Epub 2008 Oct 5.

High-speed, miniaturized fluorescence microscopy in freely moving mice

Affiliations

High-speed, miniaturized fluorescence microscopy in freely moving mice

Benjamin A Flusberg et al. Nat Methods. 2008 Nov.

Abstract

A central goal in biomedicine is to explain organismic behavior in terms of causal cellular processes. However, concurrent observation of mammalian behavior and underlying cellular dynamics has been a longstanding challenge. We describe a miniaturized (1.1 g mass) epifluorescence microscope for cellular-level brain imaging in freely moving mice, and its application to imaging microcirculation and neuronal Ca(2+) dynamics.


Figures

Figure 1
Figure 1
Miniaturized fluorescence microscopy for high-speed brain imaging in freely behaving mice. (a) Miniaturized fluorescence microscope. (b) Cutaway view of a computer-aided design (CAD) drawing of the microscope. (c) CAD drawing of the microscope’s optical components. An image of the specimen is projected onto the fiber bundle using three microlenses, one of which is a focusing lens. The bidirectional arrow shows the 1.1-mm movement range of this lens. A bundle of rays (blue) is shown passing through the optics on the axis. (d) Illumination and light collection pathways. Illumination from a Hg-arc lamp passes through a multi-mode fiber, reflects off a dichroic mirror and is coupled into the fiber bundle. The bundle delivers illumination to the microscope on the mouse and returns the fluorescence image, which is focused onto a high-speed camera. A commutator allows the bundle to rotate as the mouse moves. An encoder tracks these rotations for offline image stabilization. EM-CCD, electron-multiplying charge-coupled device. (e) Flow chart showing procedures for image alignment and analysis. Scale bars, 1 cm.
Figure 2
Figure 2
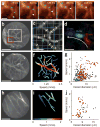
High-speed imaging of cerebral microcirculation in freely behaving mice. (a) Raw images of neocortical microcirculation in a behaving mouse. Arrowheads mark progress of single erythrocytes. (b) Image of neocortical vasculature, computed as the s.d. of images acquired over a 10-s interval. Red and white boxes enclose regions shown in a and c, respectively. (c) To determine vessel diameter and erythrocyte speed, images were divided into a grid and no more than one vessel was sampled per square. Yellow lines indicate cross-sectional vessel widths. Arrowhead points to where erythrocyte speed was computed in d. (d) Three cross-correlation maps of the area marked by a blue box in c computed at −30, 0 and +30 ms time delays, revealing average erythrocyte progression over 7 images acquired at 100 Hz. (e–j) Images of neocortical vasculature (e) and hippocampal vasculature (h) in an awake, freely moving mouse, obtained as in b, and maps of erythrocyte speed across the respective image (f,i). Plots of average erythrocyte speed versus vessel diameter in the neocortex (g) and hippocampus (j) of behaving mice. The data points in each plot were acquired from three different mice (n = 6 mice analyzed in total), with the data points from each mouse uniformly colored red, blue or black. Each data point color represents a different mouse. Neocortical images acquired at 100 Hz with 3 × 3 pixel-binning on the camera and 450–550 μW illumination. Hippocampal images acquired at 75 Hz using 2 × 2 binning and 250–1,020 μW illumination. Scale bars, 20 μm (a,d), 100 μm (b,e,h) and 40 μm (c).
Figure 3
Figure 3
High-speed imaging of cerebellar Purkinje cell dendritic Ca2+ spiking. (a) Twelve dendritic tree segments identified in an unrestrained mouse sitting quietly while recovering from anesthesia. (b) Average of 8 frames in which the cell colored red in a exhibited a Ca2+ spike. (c) ΔF/F traces averaged over the color-corresponding filled areas in a. (d) Average of 350 ms windows surrounding 20 (red) and 22 (blue) Ca2+ spikes extracted by temporal deconvolution and threshold detection from the color-corresponding traces in c. The windows were triggered to begin 90 ms before the onset of the spike. (e) Seventeen dendritic tree segments identified in a freely behaving mouse. (f) Average of 4 frames in which the cell colored blue in e exhibited a Ca2+ spike. (g) ΔF/F′ averaged over the color-corresponding filled areas in e. (h) Average of 350-ms windows surrounding 37 (red) and 23 (blue) spikes from the color-corresponding traces in g. All images acquired with 3 × 3 binning of the camera pixels. Illumination power at the specimen was ~56 μW (a–d), and ~420 μW (e–h). Imaging frame rates were 62.5 Hz (a–d) and 100 Hz (e–h). Scale bars, 100 μm.
Figure 4
Figure 4
Comparisons of Purkinje cell Ca2+ spiking during rest and motor behavior. (a) For each of 42 cells, a comparison of Ca2+ spiking rates during periods when the mouse was moving versus periods of rest as determined from the rotational velocity of the mouse’s head. Line demarcates equal rates under both conditions. (b) Comparisons of Ca2+ spiking rates (mean ± s.e.m.) (left) and correlation coefficients for pairwise synchronous Ca2+ activity (right), during periods of rest and active movement, for the 42 cells analyzed in a. Modest but significant differences existed between the two behavioral states, for spiking rates and correlation coefficients (P < 10−7 and P < 10−4, respectively; one-tailed Wilcoxon signed rank test).

Comment in

References

    1. Ferezou I, Bolea S, Petersen CC. Neuron. 2006;50:617–629. - PubMed
    1. Yamaguchi S, et al. Nature. 2001;409:684. - PubMed
    1. Adelsberger H, Garaschuk O, Konnerth A. Nat Neurosci. 2005;8:988–990. - PubMed
    1. Murayama M, Perez-Garci E, Luscher HR, Larkum ME. J Neurophysiol. 2007;98:1791–1805. - PubMed
    1. Poe GR, Kristensen MP, Rector DM, Harper RM. Neuroscience. 1996;72:39–48. - PubMed

Publication types