

Sputtered iridium oxide films for neural stimulation electrodes
- PMID: 18837458
- PMCID: PMC7442142
- DOI: 10.1002/jbm.b.31223
Sputtered iridium oxide films for neural stimulation electrodes
Abstract
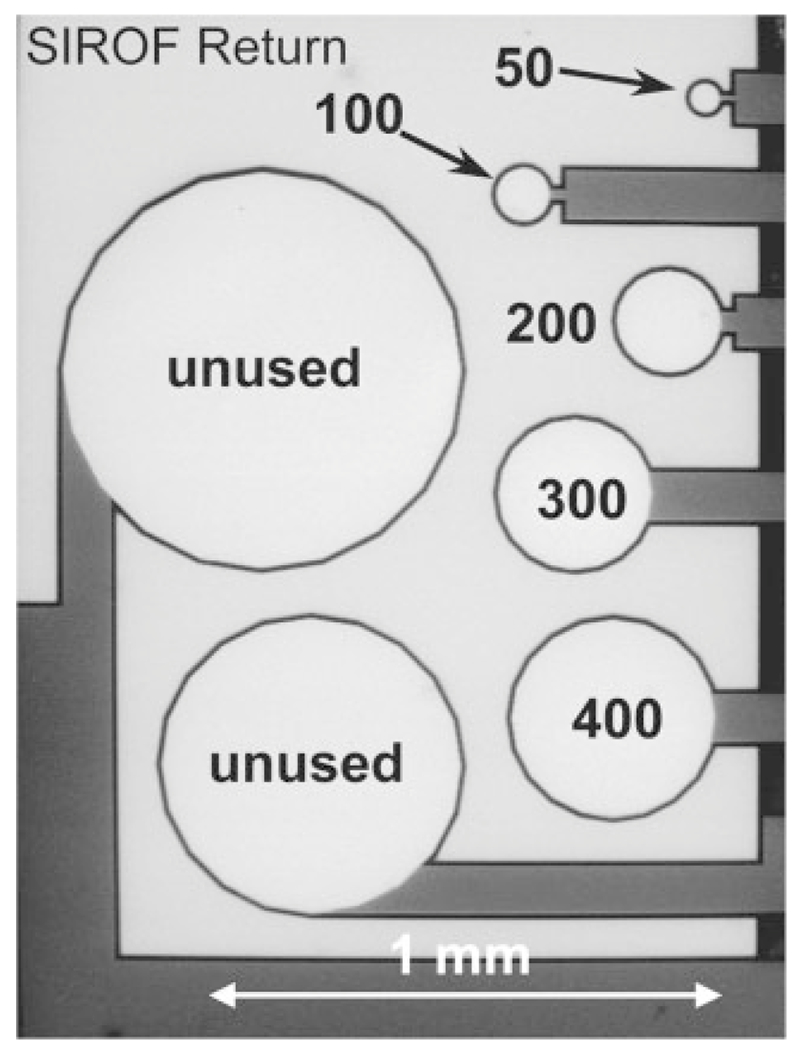
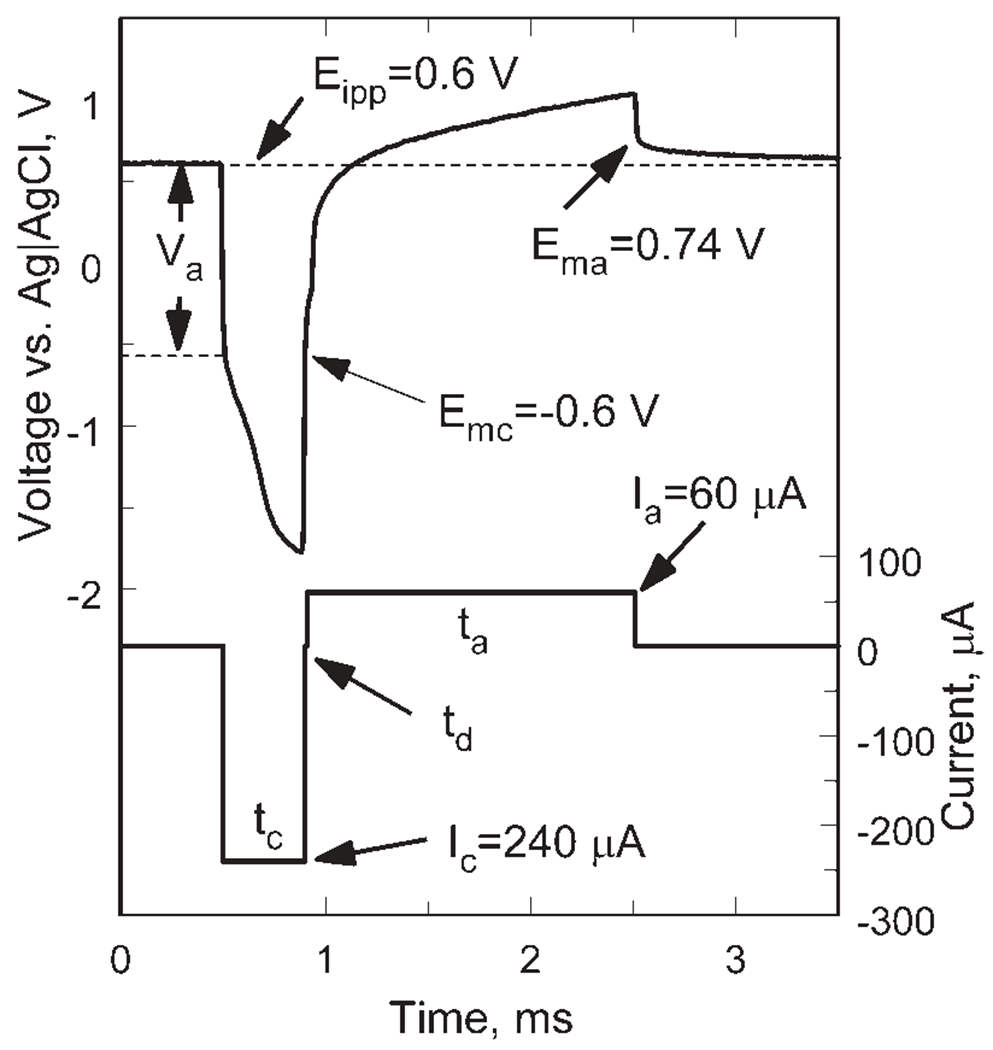
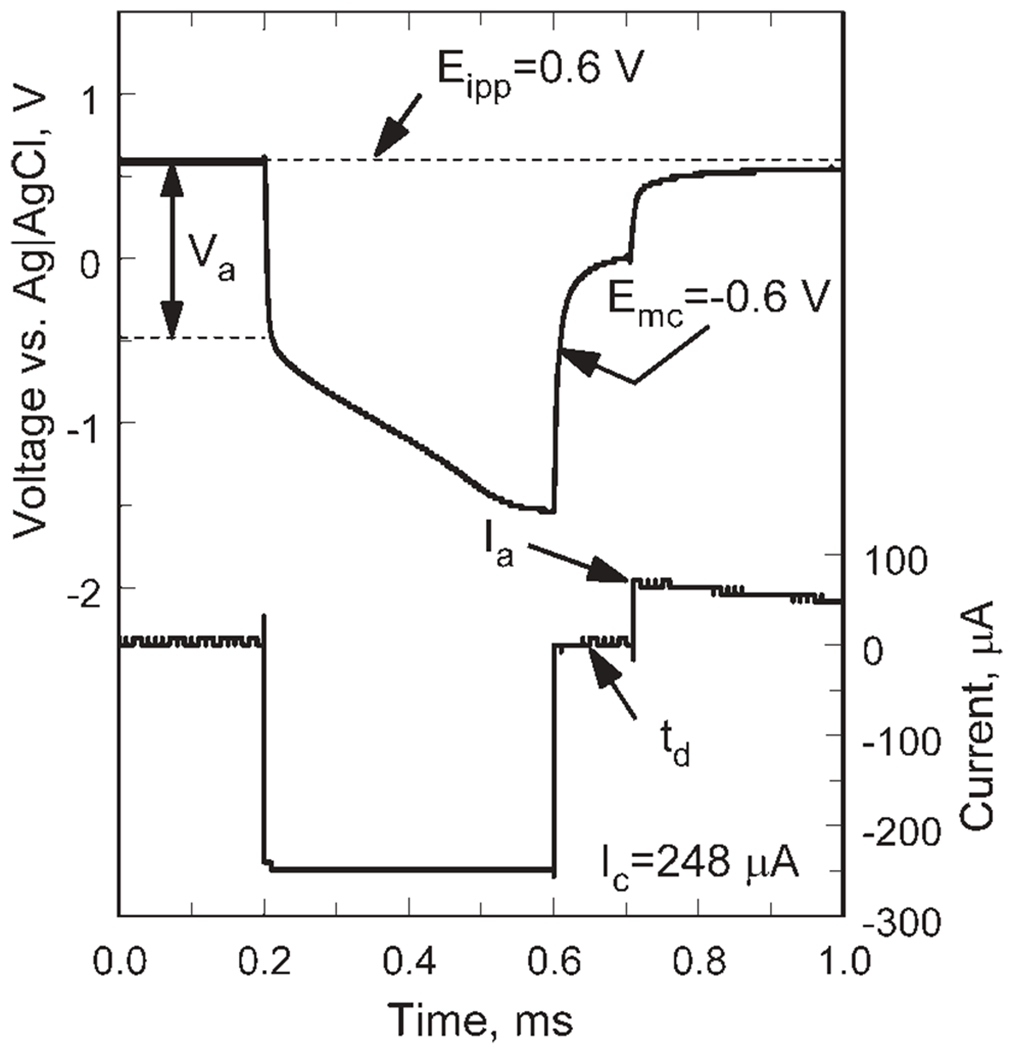
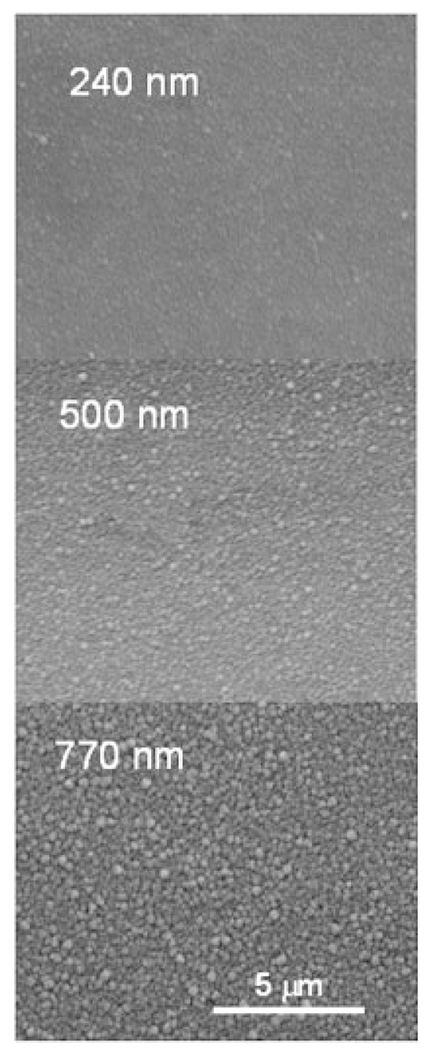
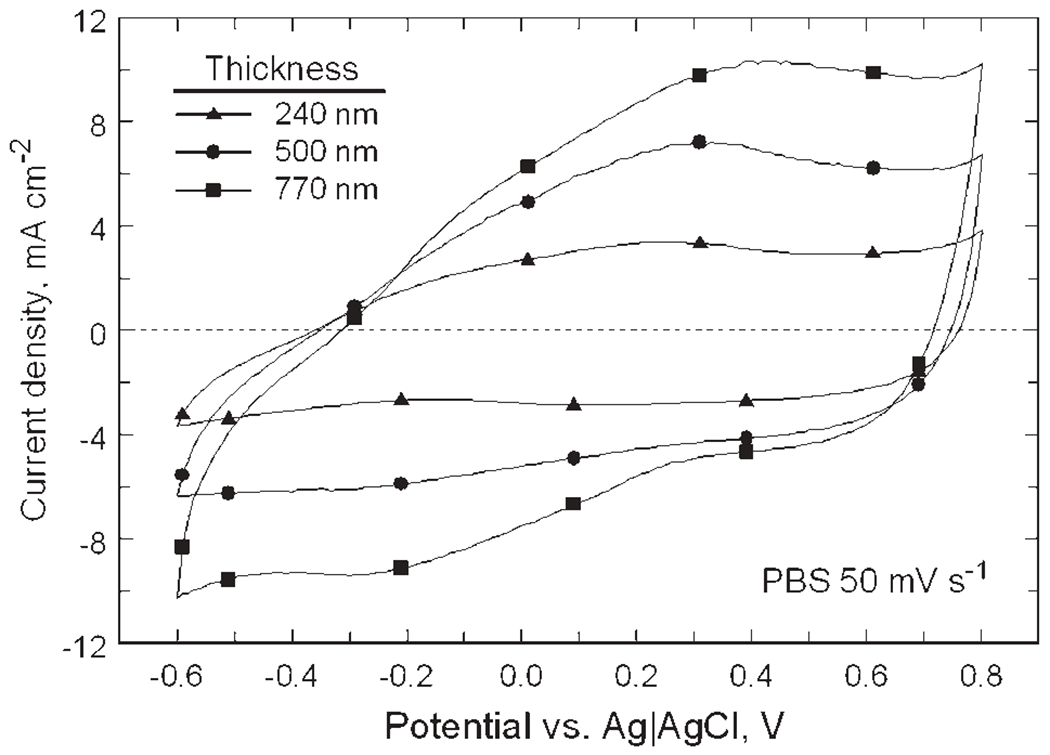
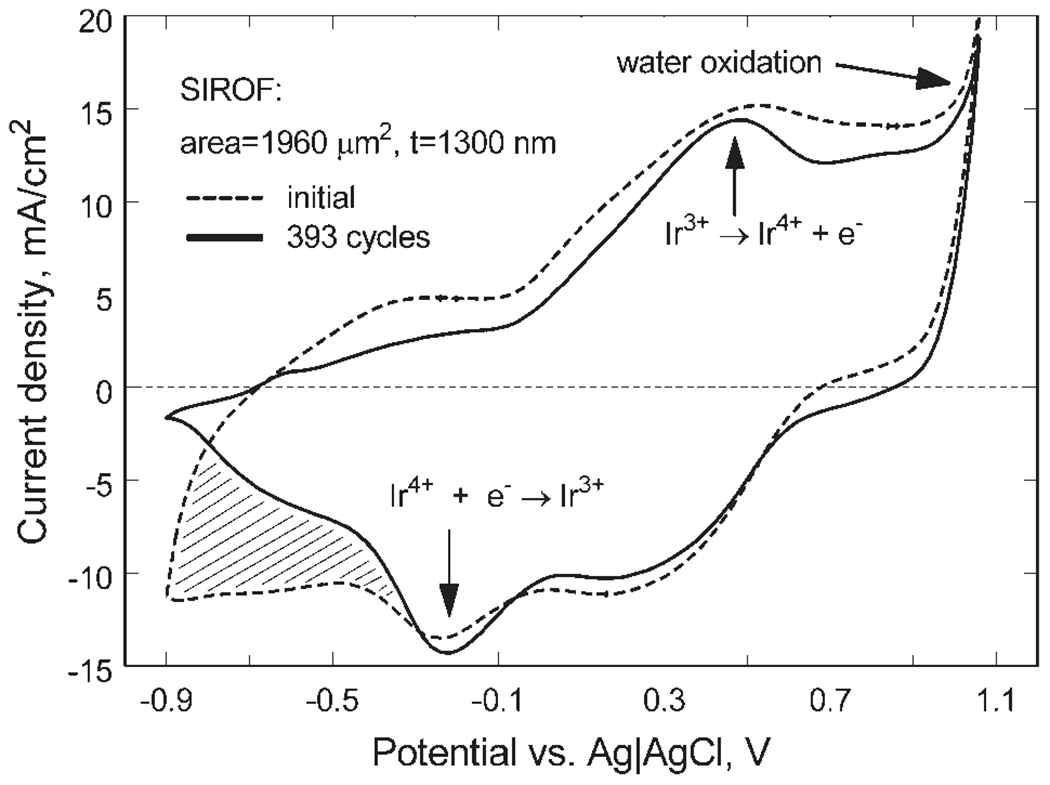
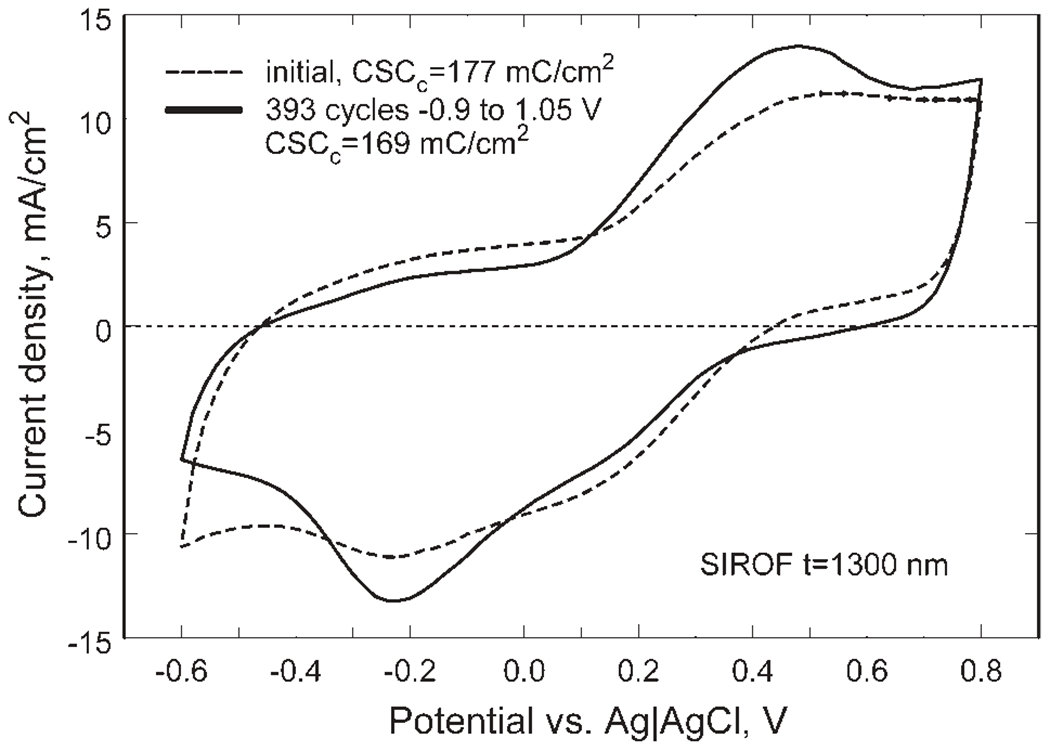
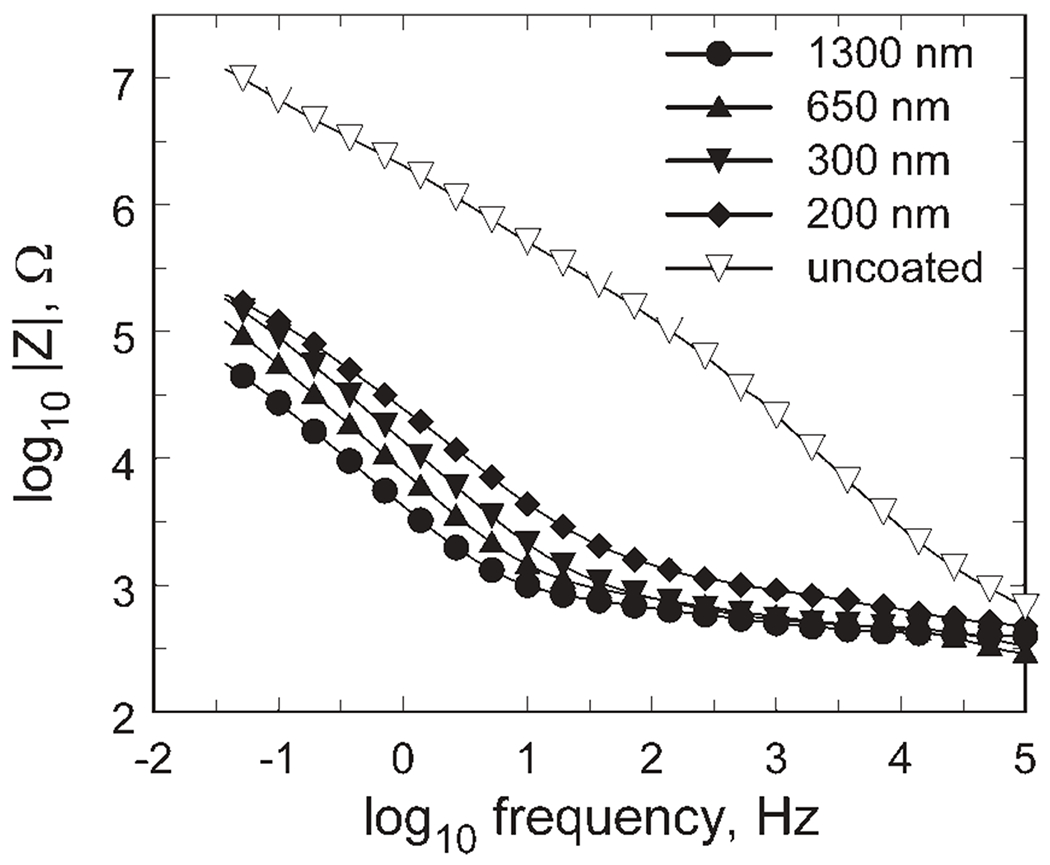
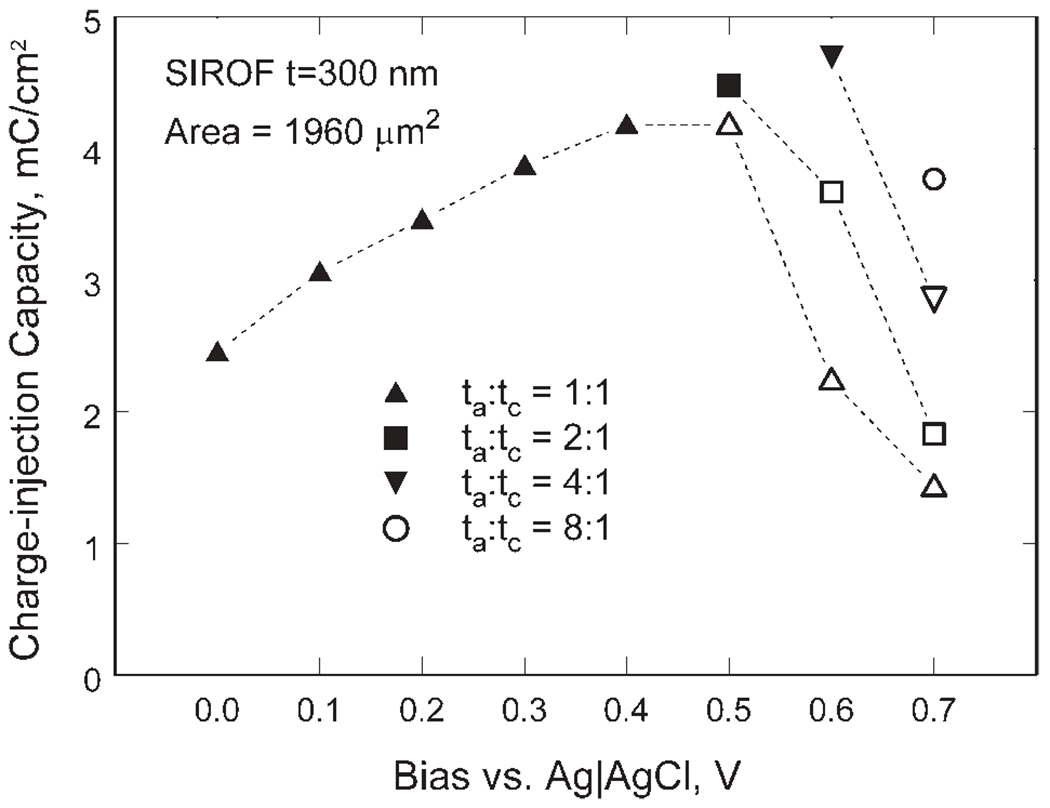
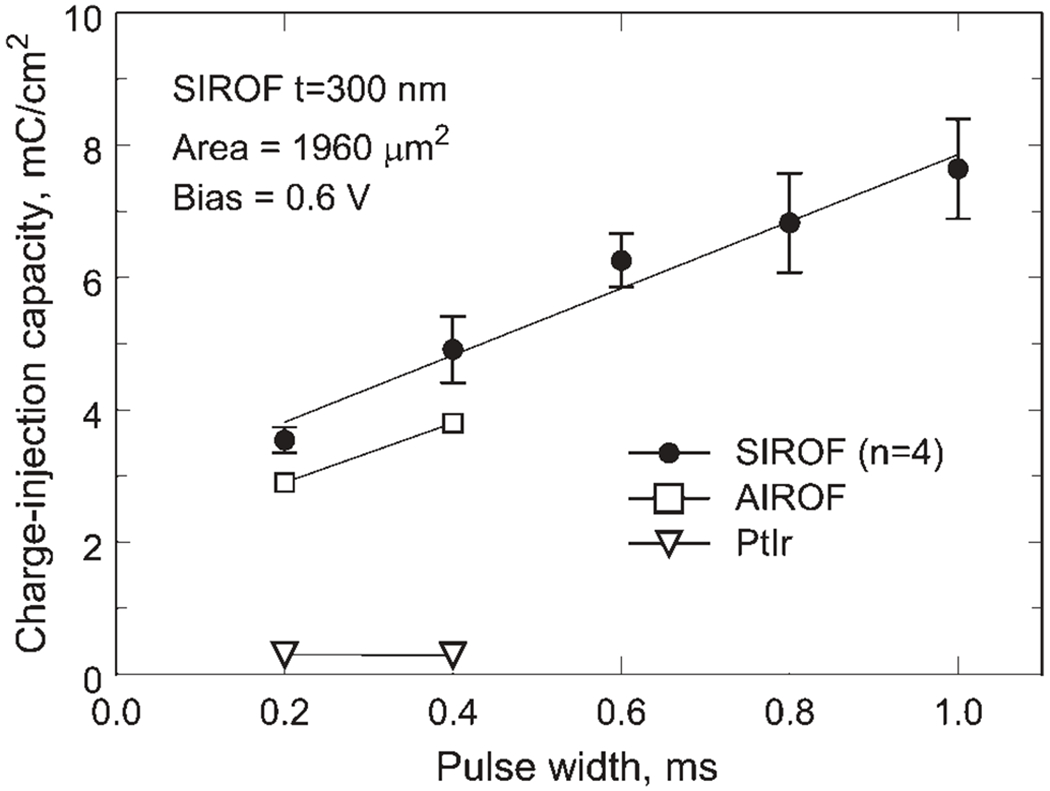
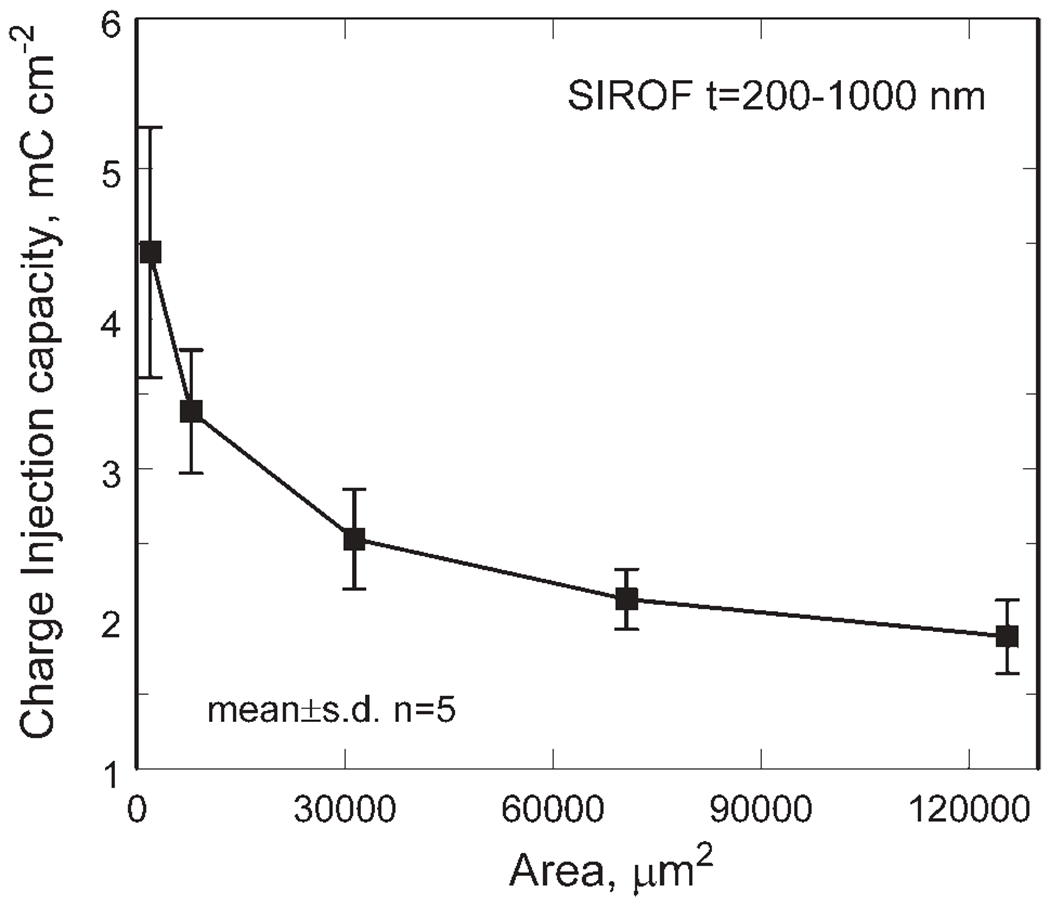
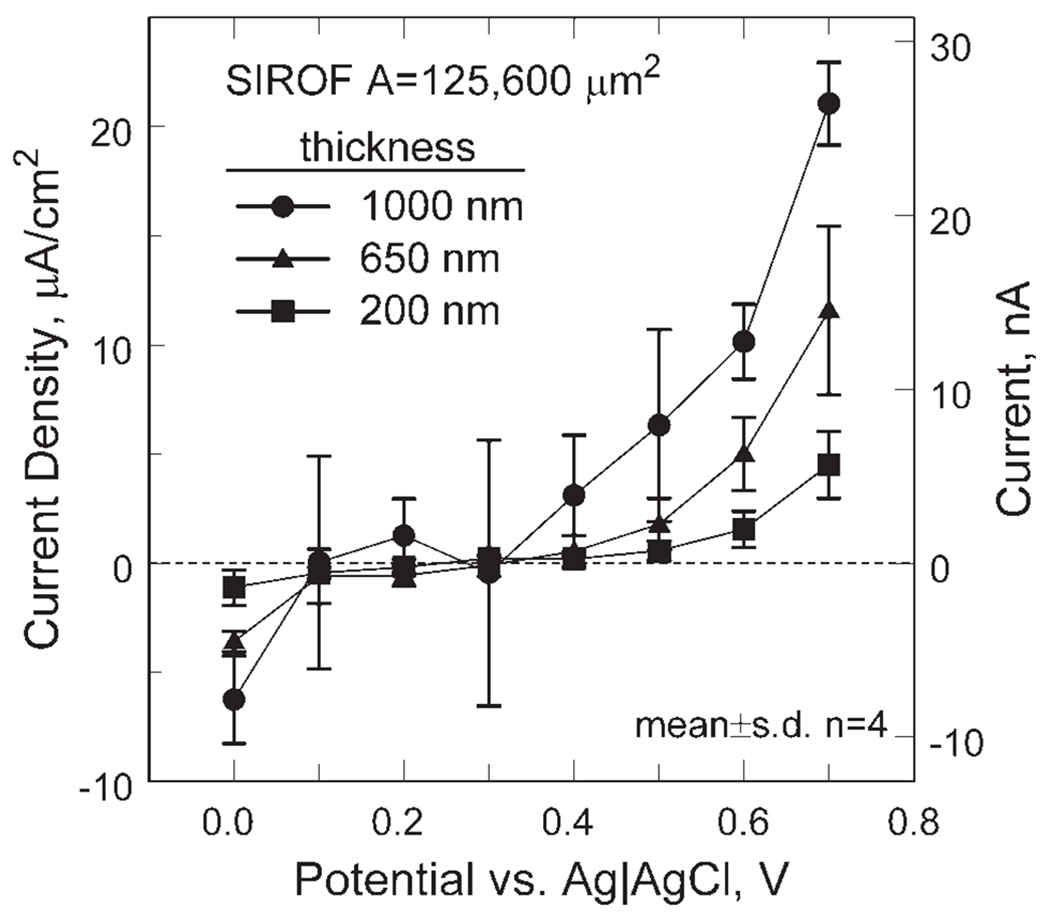
Sputtered iridium oxide films (SIROFs) deposited by DC reactive sputtering from an iridium metal target have been characterized in vitro for their potential as neural recording and stimulation electrodes. SIROFs were deposited over gold metallization on flexible multielectrode arrays fabricated on thin (15 microm) polyimide substrates. SIROF thickness and electrode areas of 200-1300 nm and 1960-125,600 microm(2), respectively, were investigated. The charge-injection capacities of the SIROFs were evaluated in an inorganic interstitial fluid model in response to charge-balanced, cathodal-first current pulses. Charge injection capacities were measured as a function of cathodal pulse width (0.2-1 ms) and potential bias in the interpulse period (0.0 to 0.7 V vs. Ag|AgCl). Depending on the pulse parameters and electrode area, charge-injection capacities ranged from 1-9 mC/cm(2), comparable with activated iridium oxide films (AIROFs) pulsed under similar conditions. Other parameters relevant to the use of SIROF on nerve electrodes, including the thickness dependence of impedance (0.05-10(5) Hz) and the current necessary to maintain a bias in the interpulse region were also determined.
(c) 2008 Wiley Periodicals, Inc.
Figures
Similar articles
-
In vitro comparison of sputtered iridium oxide and platinum-coated neural implantable microelectrode arrays.Biomed Mater. 2010 Feb;5(1):15007. doi: 10.1088/1748-6041/5/1/015007. Epub 2010 Feb 3. Biomed Mater. 2010. PMID: 20124668
-
High-charge-capacity sputtered iridium oxide neural stimulation electrodes deposited using water vapor as a reactive plasma constituent.J Biomed Mater Res B Appl Biomater. 2020 Apr;108(3):880-891. doi: 10.1002/jbm.b.34442. Epub 2019 Jul 28. J Biomed Mater Res B Appl Biomater. 2020. PMID: 31353822
-
Sputtered iridium oxide films (SIROFs) for low-impedance neural stimulation and recording electrodes.Conf Proc IEEE Eng Med Biol Soc. 2004;2004:4153-6. doi: 10.1109/IEMBS.2004.1404158. Conf Proc IEEE Eng Med Biol Soc. 2004. PMID: 17271216 Free PMC article.
-
Neural stimulation and recording electrodes.Annu Rev Biomed Eng. 2008;10:275-309. doi: 10.1146/annurev.bioeng.10.061807.160518. Annu Rev Biomed Eng. 2008. PMID: 18429704 Review.
-
Nanostructuration strategies to enhance microelectrode array (MEA) performance for neuronal recording and stimulation.J Physiol Paris. 2012 May-Aug;106(3-4):137-45. doi: 10.1016/j.jphysparis.2011.10.001. Epub 2011 Oct 18. J Physiol Paris. 2012. PMID: 22027264 Review.
Cited by
-
Neuroprosthetic technology for individuals with spinal cord injury.J Spinal Cord Med. 2013 Jul;36(4):258-72. doi: 10.1179/2045772313Y.0000000128. J Spinal Cord Med. 2013. PMID: 23820142 Free PMC article. Review.
-
Focal stimulation of retinal ganglion cells using subretinal 3D microelectrodes with peripheral electrodes of opposite current.Biomed Eng Lett. 2023 Dec 26;14(2):355-365. doi: 10.1007/s13534-023-00342-3. eCollection 2024 Mar. Biomed Eng Lett. 2023. PMID: 38374901 Free PMC article.
-
Demonstration of a Robust All-Silicon-Carbide Intracortical Neural Interface.Micromachines (Basel). 2018 Aug 18;9(8):412. doi: 10.3390/mi9080412. Micromachines (Basel). 2018. PMID: 30424345 Free PMC article.
-
In vivo imaging of calcium and glutamate responses to intracortical microstimulation reveals distinct temporal responses of the neuropil and somatic compartments in layer II/III neurons.Biomaterials. 2020 Mar;234:119767. doi: 10.1016/j.biomaterials.2020.119767. Epub 2020 Jan 7. Biomaterials. 2020. PMID: 31954232 Free PMC article.
-
Iridium oxide nanotube electrodes for sensitive and prolonged intracellular measurement of action potentials.Nat Commun. 2014;5:3206. doi: 10.1038/ncomms4206. Nat Commun. 2014. PMID: 24487777 Free PMC article.
References
-
- Merrill DR, Bikson M, Jefferys JGR. Electrical stimulation of excitable tissue: Design of efficacious and safe protocols J Neurosci Methods 2005;141:171–198. - PubMed
-
- Cogan SF, Troyk PR, Ehrlich J, Plante TD. In vitro comparison of the charge-injection limits of activated iridium oxide (AIROF) and platinum-iridium microelectrodes. IEEE Trans Biomed Eng 2005;52:612–614. - PubMed
-
- McCreery DB, Agnew WF, Bullara LA. The effects of prolonged intracortical microstimulation on the excitability of pyramidal tract neurons in the cat. Ann Biomed Eng 2002;30: 107–119. - PubMed
-
- McCreery DB, Yuen TGH, Bullara LA. Chronic microstimulation in the feline ventral cochlear nucleus: Physiologic and histologic effects, Hearing Res 2000;149:223–238. - PubMed
-
- McCreery DB, Lossinsky A, Pikov V, Liu X. Microelectrode array for chronic deep-brain microstimulation and recording, IEEE Trans Biomed Eng 2006;53:726–737. - PubMed
Publication types
MeSH terms
Substances
Grants and funding
LinkOut - more resources
Full Text Sources
Other Literature Sources
