. 2008 Sep;9(9):739-46.
doi: 10.1631/jzus.B0820127.

Relationships among magnetic resonance imaging, histological findings, and IGF-I in steroid-induced osteonecrosis of the femoral head in rabbits

Affiliations

Relationships among magnetic resonance imaging, histological findings, and IGF-I in steroid-induced osteonecrosis of the femoral head in rabbits

Xing-can Chen et al. J Zhejiang Univ Sci B. 2008 Sep.

Abstract

Objective: To study the relationships among magnetic resonance imaging (MRI), histological findings, and insulin-like growth factor-I (IGF-I) in steroid-induced osteonecrosis of the femoral head in rabbits.

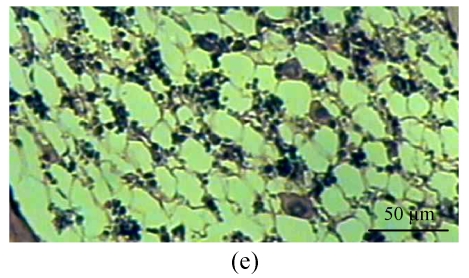
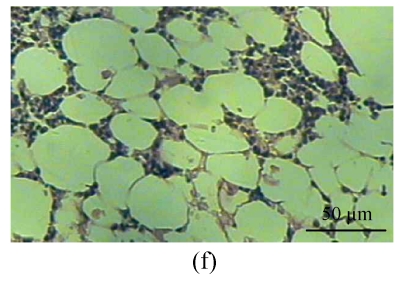
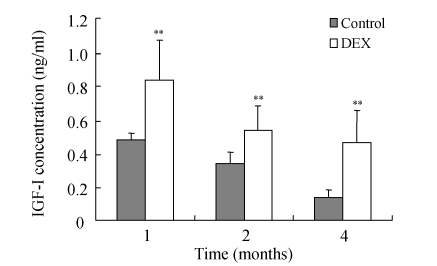
Methods: Thirty rabbits were randomly divided into experimental Group A (n=15) and control Group B (n=15). The 7.5 mg/kg (2 ml) of dexamethasone (DEX) and physiological saline (2 ml) were injected into the right gluteus medius muscle twice at one-week intervals in animals of Groups A and B, respectively. At 4, 8 and 16 weeks after obtaining an MRI, the rabbits were sacrificed and the femoral head from one side was removed for histological study of lacunae empty of osteocytes, subchondral vessels, and size of fat cells under microscopy, and the femoral head from the other side was removed for enzyme-linked immunoadsorbent assay (ELISA) for IGF-I.

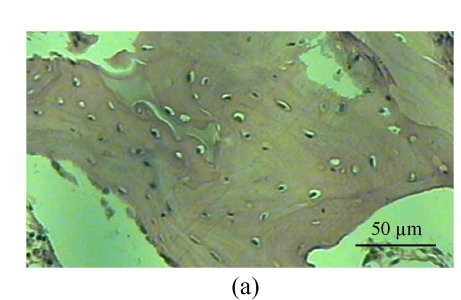
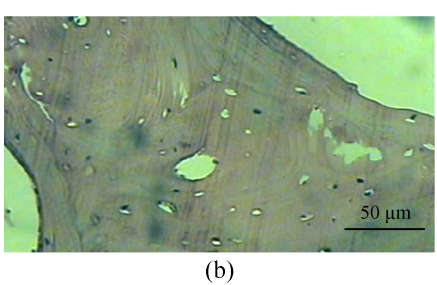
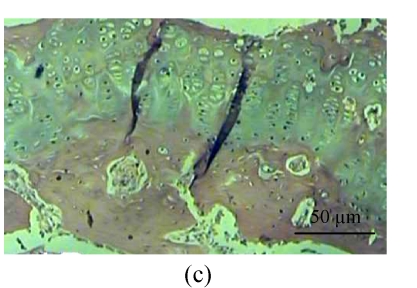
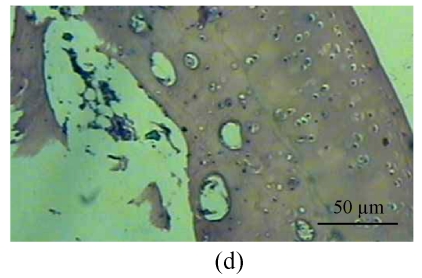
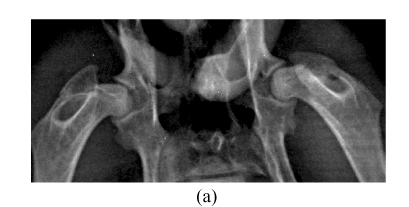
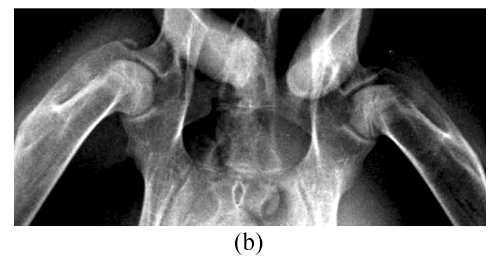
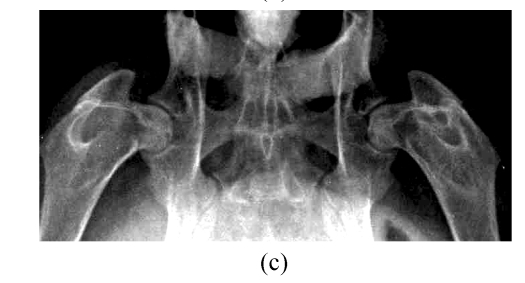
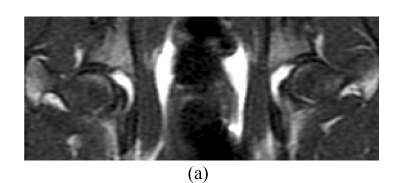
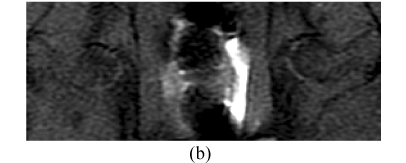
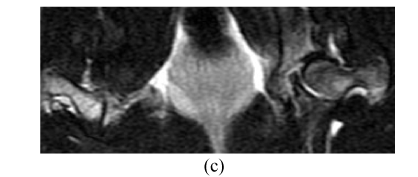
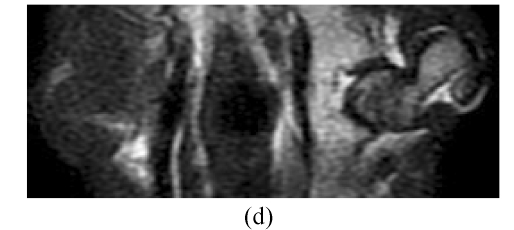
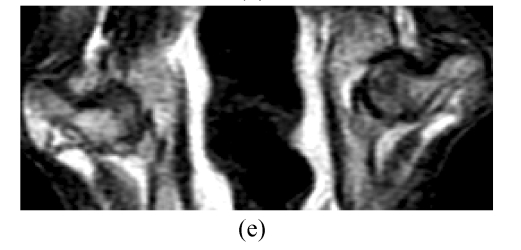
Results: At 4, 8 and 16 weeks after treatment, no necrotic lesions were detected in Group B, while they were detected in Group A. Light microscopy revealed that the fat cells of the marrow cavity were enlarged, subchondral vessels were evidently decreased, and empty bone lacunae were clearly increased. The IGF-I levels in Group A were significantly higher than those in Group B. At 8 weeks after the DEX injection, the MRI of all 20 femora showed an inhomogeneous, low signal intensity area in the femoral head, and at 16 weeks, the findings of all 10 femora showed a specific "line-like sign". The MRI findings of all femora in Group B were normal.

Conclusion: MRI is a highly sensitive means of diagnosing early experimental osteonecrosis of the femoral head. However, the abnormal marrow tissues appeared later than 4 weeks when the expression of IGF-I increased. This reparative factor has an early and important role in response to steroid-induced osteonecrosis of the femoral head, and provides a theoretical foundation for understanding the pathology and designing new therapies.


Figures

Fig. 1
Fig. 1
Histological study of the light microscopy (HE staining). (a) Normal lacunae in Group B; (b) Empty lacunae increased 16 weeks after DEX injection in Group A; (c) Normal subchondral vessels in Group B; (d) Subchondral vessels decreased 16 weeks after DEX injection in Group A; (e) Normal fat cells of marrow cavity in Group B; (f) Enlarged fat cells of marrow cavity 16 weeks after DEX injection in Group A
Fig. 1
Fig. 1
Histological study of the light microscopy (HE staining). (a) Normal lacunae in Group B; (b) Empty lacunae increased 16 weeks after DEX injection in Group A; (c) Normal subchondral vessels in Group B; (d) Subchondral vessels decreased 16 weeks after DEX injection in Group A; (e) Normal fat cells of marrow cavity in Group B; (f) Enlarged fat cells of marrow cavity 16 weeks after DEX injection in Group A
Fig. 2
Fig. 2
Results of IGF-I assay at 4, 8 and 16 weeks after DEX injection. DEX was injected into the right gluteus medius muscle in DEX group, while control was injected with physiological saline
Fig. 3
Fig. 3
CR study. (a) Normal radiographic morphology of the femoral head, trabecular bone and bone density throughout the study in Group B; (b) Radiographic morphology of the femoral heads in Group A was normal, but the metaphysis and diaphysis showed osteoporosis, and trabecular bone became irregular and unclear at 4 weeks; (c) Radiographic morphology of the femoral heads of Group A was normal, but low-density patchy shadows and radiolucent cystic areas were seen in the femoral head at 16 weeks
Fig. 3
Fig. 3
CR study. (a) Normal radiographic morphology of the femoral head, trabecular bone and bone density throughout the study in Group B; (b) Radiographic morphology of the femoral heads in Group A was normal, but the metaphysis and diaphysis showed osteoporosis, and trabecular bone became irregular and unclear at 4 weeks; (c) Radiographic morphology of the femoral heads of Group A was normal, but low-density patchy shadows and radiolucent cystic areas were seen in the femoral head at 16 weeks
Fig. 4
Fig. 4
In Group B, MRI showing homogeneously low or intermediate signal intensity on T1W image (a) and STIRE image (b), homogeneously high or intermediate signal intensity on T2W image (c); In Group A, MRI showing an inhomogeneous and low signal intensity area in the femoral head on T1W image (d) and specific “line-like sign” in the femoral head on T1W image (e)
Fig. 4
Fig. 4
In Group B, MRI showing homogeneously low or intermediate signal intensity on T1W image (a) and STIRE image (b), homogeneously high or intermediate signal intensity on T2W image (c); In Group A, MRI showing an inhomogeneous and low signal intensity area in the femoral head on T1W image (d) and specific “line-like sign” in the femoral head on T1W image (e)

References

    1. Brody AS, Strong M, Babikian G. Avascular necrosis: early MR imaging and histologic findings in a canine model. AJR. 1991;157(2):341–345. - PubMed
    1. Catanese VM, Svfiavolino PJ, Lango MN. Discordant, organspecific regulation of insulin-like growth factor-I messenger ribonucleic acid in insulin-deficient diabetes in rats. Endocrinology. 1993;132(2):496–503. doi: 10.1210/en.132.2.496. - DOI - PubMed
    1. Cheng MZ, Simon CF, Rawlinsine AA. Human osteoblast proliferative responses to strain and 17beta2 estrodiol are mediated by the estrogen receptor and the receptor for lnsulin-like growth factor I. J Bone Miner Res. 2002;17(4):593–602. doi: 10.1359/jbmr.2002.17.4.593. - DOI - PubMed
    1. Cui Q, Wang GJ, Balian G. Steroid-induced adipogenesis in a pluripotential cell line from bone marrow. J Bone Joint Surg. 1997;79(7):1054–1063. - PubMed
    1. D′Ercole AJ, Stiles AD, Underwood LE. Tissue concentrations of somatomedin-C: further evidence for multiple sites of synthesis and paracrine or autocrine mechanisms of action. Proc Natl Acad Sci USA. 1984;81(3):935–939. doi: 10.1073/pnas.81.3.935. - DOI - PMC - PubMed

Publication types