. 2008 Oct 6:7:7.
doi: 10.1186/1476-5926-7-7.

Non invasive in vivo investigation of hepatobiliary structure and function in STII medaka (Oryzias latipes): methodology and applications

Affiliations

Non invasive in vivo investigation of hepatobiliary structure and function in STII medaka (Oryzias latipes): methodology and applications

Ron C Hardman et al. Comp Hepatol. .

Abstract

Background: A novel transparent stock of medaka (Oryzias latipes; STII), recessive for all pigments found in chromatophores, permits transcutaneous imaging of internal organs and tissues in living individuals. Findings presented describe the development of methodologies for non invasive in vivo investigation in STII medaka, and the successful application of these methodologies to in vivo study of hepatobiliary structure, function, and xenobiotic response, in both 2 and 3 dimensions.

Results: Using brightfield, and widefield and confocal fluorescence microscopy, coupled with the in vivo application of fluorescent probes, structural and functional features of the hepatobiliary system, and xenobiotic induced toxicity, were imaged at the cellular level, with high resolution (< 1 microm), in living individuals. The findings presented demonstrate; (1) phenotypic response to xenobiotic exposure can be investigated/imaged in vivo with high resolution (< 1 microm), (2) hepatobiliary transport of solutes from blood to bile can be qualitatively and quantitatively studied/imaged in vivo, (3) hepatobiliary architecture in this lower vertebrate liver can be studied in 3 dimensions, and (4) non invasive in vivo imaging/description of hepatobiliary development in this model can be investigated.

Conclusion: The non-invasive in vivo methodologies described are a unique means by which to investigate biological structure, function and xenobiotic response with high resolution in STII medaka. In vivo methodologies also provide the future opportunity to integrate molecular mechanisms (e.g., genomic, proteomic) of disease and toxicity with phenotypic changes at the cellular and system levels of biological organization. While our focus has been the hepatobiliary system, other organ systems are equally amenable to in vivo study, and we consider the potential for discovery, within the context of in vivo investigation in STII medaka, as significant.


Figures

Figure 1
Figure 1
In vivo imaging of tumor formation in STII medaka: brightfield microscopy. Neoplastic response following early life stage exposure of STII medaka to the reference hepatocarcinogen diethylnitrosamine (DEN). Medaka acutely exposed at early life stages to DEN were followed serially, and at 10 months hepatic tumors were imaged through the abdominal wall. (A and C) In vivo imaging (brightfield) of hepatic tumor formation (green arrowheads) in DEN exposed medaka, showing enlargement of total liver mass and altered vasculature. Histopathological assessment of the tumor showed mixed hepatocellular (B) and cholangiocellular carcinomas (D). Biliary hyperplasia (D) was characterized by a single layer of biliary epithelium lining large cystic spaces in the liver. Opaque white tissue in brightfield images (A&C) is ovary, whereas the gut occupies caudal most region of the abdominal cavity.
Figure 2
Figure 2
In vivo imaging of hepatobiliary metabolism, transport, and hepatic morphology. Utilizing endogenous tissue autofluorescence in tandem with exogenous fluorescent probes allowed in vivo elucidation of biological structure and function. Illustrated is the in vivo application of 7-benzyloxyresorufin (7BR) for detection of CYP3A metabolic activity. Dechorionated embryos exposed (aqueous bath) to the CYP3A substrate 7BR exhibited 7-benzyloxyresorufin-O-dealkylation (BROD) activity, which resulted in the generation of the fluorescent metabolite resorufin (red). All in vivo images from an individual STII medaka, 6 dpf. (A) Brightfield microscopy, showing liver (L) and gall bladder (GB). (B1) Same animal as in frame A, imaged with widefield fluorescence microscopy (DAPI/UV excitation) illustrating tissue autofluorescence. (B2) Widefield fluorescence (TRITC) image capture of resorufin (indicative of CYP3A metabolic activity) fluorescence in the intrahepatic biliary passageways of the embryonic liver. Resorufin fluorescence is distinct and limited to the intrahepatic biliary passageways of the liver (L) and gall bladder (GB). (B3) Color composite of B1 and B2, DAPI/TRITC image captures, illustrating resorufin fluorescence (red) in the liver (L) and gall bladder (GB). (C1 and C2) In vivo imaging of region of interest in frame B3 (white square) showing in vivo phenotype of hepatic parenchyma at 6 dpf. Six to 8 hepatocytes were observed (in transverse section) to surround a central bile passageway (IHBP) at their apical membranes. C2 illustrates concentrative transport of resorufin from hepatocellular cytosol to intrahepatic biliary passageways (IHBPs), indicated by increased fluorescence in the tubule lumen, or intrahepatic biliary passageway. Red blood cells were observed actively circulating through hepatic sinusoids (S/r). Hepatocyte nuclei (HN).
Figure 3
Figure 3
Differential uptake and transport of fluorescent probes β-Bodipy C5-HPC, Bodipy FL C5 Ceramide and Bodipy 505/515: Widefield and confocal fluorescence microscopy. (A – C) β-Bodipy C5 ceramide uptake and distribution: the ceramide fluorophore (green) exhibited properties consistent with passive diffusion across cell membranes, with distinct uptake over the gill (GL) and transport through the cardiovascular system. The fluorophore was not observed to cross the blood-brain barrier (C), though it persisted in vasculature, with a residence time of hours to days (depending on exposure regime). (D) In contrast, β-Bodipy C5 phosphocholine (HPC) was observed to label neurons in the hind brain of STII medaka. Frame D is a confocal fluorescence image (from 3D projection) of β-Bodipy C5 phosphocholine labeling neural bundles in the corpus cerebelli, crista cerebellaris and medulla, 90 minutes post fluorophore exposure (aqueous bath) (STII medaka, 18 dpf). Corpus cerebelli, crista cerebellaris and medulla are region of interest indicated by gray rectangle in frame (C). (E1 and E2) Widefield fluorescence microscopy of Bodipy 505/515 secretion (red fluorescence) from gall bladder (GB) through the cystic duct (CD) and common bile duct (CBD) into the gut lumen. Mucosol folds of the gut (Mf) are the result of β-Bodipy C5 ceramide fluorescence (co-administered with Bodipy 505/515). Ventral aorta (Va), Heart Ventricle (Hv), Heart Atrium (Ha), Liver (L), Pineal Gland (P), Optic Tectum (Ot), Otic Vesicle (Ov), Vasculature (V).
Figure 4
Figure 4
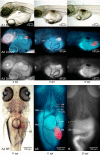
In vivo investigations of hepatobiliary development. (A1 – 1st row) Brightfield microscopy. (A2-2nd row) Composites of DAPI and TRITC image captures, revealing gall bladder (GB) position (red). (A3 – 3rd row) DAPI autofluorescence elucidating vasculature. At day of hatching, 8 dpf, the liver was found as the left lateral longitudinal liver leaflet (L5) phenotype, left lateral and ventral to the 3rd somite (A1 – A3, 1st column). From 8 to 11 dpf the L5 liver and gall bladder descended to the ventral abdomen, with marked restructuring of the visceral and hepatic vasculature. Translocation of the L5 liver and gall bladder to the ventral abdomen (A4, A5) was characterized by: descent of the liver and GB, which remained in a longitudinal position, yolk resorption, the disappearance of the stomatodeal and proctodeal membranes (not shown), the onset of peristalsis, and the beginning of respiration. (A4) Brightfield microscopy, 11 dpf, ventral view, showing liver, gall bladder and lipid droplet. (A5) Widefield fluorescence microscopy, DAPI/TRITC composite, ventral view, elucidating liver, gall bladder and vasculature. The onset of metamorphosis of the hepatobiliary system to a transverse position in the rostral abdominal cavity (adult phenotype) began at 11 dpf. (B) Widefield fluorescence microscopy, DAPI image capture, ventral view. By 20 dpf the liver and gall bladder were transverse in the ventro-rostral abdominal cavity, marking the attainment of the adult phenotype. As can be discerned from the images shown, marked restructuring of the vasculature accompanied metamorphosis of the liver and gall bladder from an embryonic to adult phenotype. While such observations are purely descriptive, they permitted characterization of hallmark events in hepatobiliary development and helped establish normalcy in vivo. Liver (L), Gall Bladder (GB), Heart Atrium (Ha), Heart Ventricle (Hv), Sinus Venosus (Sv), Hepatic Vein (Hv), Left Duct of Cuvier (Ldc), Median Yolk Vein (Myv), Lipid Droplet (LD).
Figure 5
Figure 5
In vivo imaging of hepatobiliary transport. Fluorophores such as β-Bodipy C5 phosphocholine, shown here, enabled in vivo elucidation of the biliary system and quantitation of blood to bile transport. (A) Brightfield microscopy of STII medaka at 30 dpf. Green algae can be seen in transport through lumen of the gut. (A1) Widefield fluorescence microscopy of region of interest indicated by gray square in A, showing β-Bodipy C5 phosphocholine fluorescence in intrahepatic biliary passageways (IHBPs) of the liver (L) and gall bladder (GB). (B) Confocal DIC microscopy, STII medaka, 9 dpf: Clearly resolved were hepatocytes and their nuclei/nucleoli. In longitudinal section 2 rows of hepatocytes characterize parenchymal architecture. Stacked ovate structures are red blood cells in circulation through the sinusoids (S/r). Red cells appear flattened due to active circulation of cells through sinusoids, and resulting distortion during imaging. (B1) Same as B: Single frame from in vivo confocal image stack capturing β-Bodipy C5 phosphocholine (green fluorescence) in transport from blood to bile, through intrahepatic biliary passageways (IHBPs) of the liver (imaged in vivo 30 minutes post fluorophore administration). (B2) Composite of frames B and B1 localizing fluorophore transport to area between apical membranes of adjacent hepatocytes, suggesting concentrative transport of the fluorophore into IHBPs. (C and D) Frame C is a surface map of region of interest (white square) in frame B1, illustrating concentrative transport of the fluorophore from sinusoidal space (S) to bile space (IHBP). (D) Quantitative evaluation of the white rectangular region of interest in frame B1, spanning an 18.3 μm area from blood to bile (sinusoid to canaliculus), suggested β-Bodipy C5 phosphocholine concentration (fluorescence intensity) to be ~20 times greater in the canalicular (IHBP) vs. sinusoidal spaces (S). Also evident is an increase in cytosolic concentration of the fluorophore, while no fluorescence was detected in the nucleus. These types of studies demonstrated concentrative transport of fluorescent probes from blood to bile can be imaged and quantitatively assessed in vivo. Confocal images captured with C-apochromatic objective, 1.2 NA w/correction, 488 nm excitation, Zeiss LSM 510. Field size: 76.8 × 76.8 μm.
Figure 6
Figure 6
Quantitative analysis of blood to bile transport in vivo (STII medaka, 12 dpf): β-Bodipy C5 Phosphocholine (HPC), Fluorescein Isothiocyanate (FTIC) and Bodipy C5 ceramide. Box plots (area averages) and statistical indices: Quantitative analysis of differential blood to bile transport between β-Bodipy C5 phosphocholine (HPC), fluorescein isothiocyanate (FTIC) and Bodipy C5 ceramide. Fluorophores were imaged in vivo at peak uptake times (60 minutes for C5 ceramide, 45 minutes for both FITC and HPC). Differences in blood to bile transport between all three fluorophores were suggested when measured values (means) of fluorescence intensity across sinusoid, cytosol and canalicular spaces were evaluated. The most marked differences were between β-Bodipy C5 phosphocholine and fluorescein isothiocyanate, and Bodipy C5 ceramide. For instance: Where ceramide and FITC showed no statistical difference in concentration in the canaliculus, there were marked differences in concentration, and temporal variation, in cytosol and sinusoid, suggesting differences in transport kinetics.
Figure 7
Figure 7
In vivo imaging of hepatobiliary toxicity: canalicular attenuation/dilation and bile preductular lesions. (A) In vivo confocal image of untreated medaka liver (30 dpf), illustrating normal appearance of IHBPs, characterized by uniform diameter. (B – B1) In vivo confocal image, single optical section, of ANIT treated medaka liver (24 dpf) illustrating appearance of dilated and attenuated bile canaliculi (red arrowhead points to attenuation, white to dilation), 48 hrs post exposure to 2.5 μM ANIT. Canaliculi were elucidated with fluorescein isothiocyanate. Only the intrahepatic biliary passageways are fluorescent (green). Parenchyma is largely non fluorescent, aside from weak and diffuse fluorescence of hepatocellular cytosol. Canalicular dilation/attenuation appeared to be a canalicular constriction/dilation regulatory problem, as no clear alteration to hepatocyte morphology was observed in association with this change. (B1) Dilated canaliculi (gray arrowhead) were found to be up to approximately 3 times normal diameter (e.g., 3.9 μm diameter in dilated vs. 1.3 μm average diameter in normal canaliculi). Attenuated canaliculi were distinct, appearing as fine sinuous passageways measuring 0.4 μm to 0.8 μm in diameter. (C) Non invasive in vivo confocal image 10 days post exposure to 2.5 μM ANIT (chronic exposure) showing bile preductular lesions (red arrowhead), characterized by loss of preductule membrane integrity and loss of uniformity in preductule lumen diameter. Intrahepatic biliary passageways elucidated here with Bodipy C5 Ceramide. Black arrowhead illustrates normal appearance of bile preductule. (C1) Transmission electron micrograph illustrating changes to bile preductular epithelium (BPDEC) associated with preductular lesions, which showed increased cytosolic area and vacuolation (red arrowhead). In vivo observations helped lead to the hypothesis that ANIT induced BPDEC toxicity is responsible for bile preductular lesions observed, and that these cells are early targets of ANIT. (D) Example of a 3D reconstruction of damaged preductule that revealed the damaged bile passageway (green) was blind ending, not interconnected with other segments of the intrahepatic biliary network (atypical). Also shown are bile preductular epithelial cells (purple), illustrating the foci of alteration was a canaliculo-preductular junction. In (A), (B), and (B1), IHBPs elucidated with FITC, in (C) with Bodipy C5 ceramide.
Figure 8
Figure 8
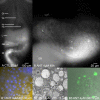
In vivo imaging of hepatobiliary toxicity: hydropic vacuolation. Acute exposures to 2 to 6 μM ANIT resulted in a marked "pebbling" phenotype. This terminology was adopted due to the morphological appearance of the liver (L), first observed in vivo with widefield fluorescence microscopy. (A) STII medaka control, 20 dpf, showing the normal smooth appearance of the hepatic parenchyma in vivo, as viewed with widefield fluorescence microscopy. (B) Widefield fluorescence microscopy, FITC image capture, STII medaka, 20 dpf. Shown is the "pebbled" appearance (black arrowhead) of the liver (L) in vivo; distinct at 2 μM to 6 μM aqueous ANIT. This phenotypic response was characterized (in vivo) by ovate structures within the cytosol of hepatocytes, which resulted in a pebbled appearance in the plane of focus in the liver. This phenotype was observed with the aid of autofluorescence alone, no fluorophores were necessary for visualizing this cellular response. (B1) ANIT exposed medaka exhibiting the pebbling phenotype were treated with the nuclear stain DAPI (aqueous bath) to label hepatocyte and biliary epithelial cell nuclei. After 1 hr of DAPI exposure the hepatobiliary systems of medaka were imaged in vivo via widefield fluorescence microscopy. These investigations found that intracellular ovate structures (black arrowhead) did not label with DAPI, and were distinguishable from hepatic and biliary epithelial nuclei (blue). (B2) Transmission electron micrograph showing cellular changes consistent with hydropic vacuolation, which was observed in both hepatocytes (black arrowhead) and bile preductular epithelia (not shown). Vacuoles ranged from 2 μm to 10 μm in diameter, and were found to be partially to completely filled with electron dense infiltrate. (B3) In vivo confocal image of YO-PRO-1, DIC and TRITC composite: nuclear labeling experiments performed with YO-PRO-1 revealed uptake of YO-PRO-1 into cells with putatively compromised cell membranes. In grayscale DIC image hydropic vacuoles (black arrowhead) are distinct. Associated with hydropic vacuolation was a slight increase in apoptosis (ovate green fluorescence, cell type not known). Of interest is the almost literal appearance of hydropic vacuoles in the confocal DIC fluorescence image (grayscale), where vacuoles appear as liquid droplets. Gill (Gl), Ventral Aorta (Va), Heart Atrium (Ha), Heart Ventricle (Hv), Liver (L), Gall Bladder (GB), Gut (Gt).
Figure 9
Figure 9
In vivo imaging of hepatobiliary toxicity: passive hepatic congestion. (A) Widefield fluorescence DAPI/UV, control liver, 20 dpf, showing the normal in vivo appearance of hepatic vasculature (black arrowhead). Vasculature appears dark (non fluorescent). Epithelium of parenchyma appears light gray. (B and C) At 4 μM ANIT, 24 hrs post exposure, modest dilation of hepatic vasculature was observed throughout the liver (black arrowhead). Image B is DAPI/UV (autofluorescence), image C is TRITC (autofluorescence). (D) At 8 μM ANIT, 24 hrs, marked dilation of the intrahepatic vasculature was observed (DAPI/UV). (E) In vivo confocal imaging, acquired at 48 hrs post ANIT exposure, confirmed dilation of intrahepatic vasculature (black arrowhead) was a pan-hepatic response, occurring uniformly throughout the liver. Vasculature is dark gray, hepatocytes (H) appear green. (F) Transmission electron micrograph (8 μM, 20 dpf, 48 hrs post exposure) of an intrahepatic vessel in ANIT treated medaka, revealing abnormal sinusoid/endothelial cell morphology (S). A single red blood cell can be seen in the sinusoid lumen. Endothelium is highly attenuated. In tandem with morphological changes were changes to cardiovascular function; decreasing heart rate and motility along with increase in vasodilation, in medaka exposed to 0.5 μM to 8 μM ANIT. Control heart rates averaged 129 bpm to 140 bpm (n = 12). Heart rate decreased with increasing ANIT concentrations. At 8 μM ANIT heart rate (means) was observed to be 118 bpm at 6 hrs post exposure, 73 bpm at 24 hrs post exposure, and 61 bpm at 48 hrs post exposure. At dosage regimes above 4 μM (acute and chronic), vasodilation of the hepatic vasculature was evident. Dilation of sinusoids, hepatic vein, and hepatic portal vein, were all observed. Sinusoid diameters: control sinusoids averaged 7.4 μm. At 8 μM ANIT, 48 hrs post exposure, sinusoid diameter averaged 15.3 μm.

Similar articles

Cited by

References

    1. Alpini G, Glaser S, Alvaro D, Ueno Y, Marzioni M, Francis H, Baiocchi L, Stati T, Barbaro B, Phinizy JL, Mauldin J, Lesage G. Bile acid depletion and repletion regulate cholangiocyte growth and secretion by a phosphatidylinositol 3-kinase-dependent pathway in rats. Gastroenterology. 2002;123:1226–1237. doi: 10.1053/gast.2002.36055. - DOI - PubMed
    1. Bove KE, Daugherty CC, Tyson W, Mierau G, Heubi JE, Balistreri WF, Setchell KD. Bile acid synthetic defects and liver disease. Pediatr Dev Pathol. 2000;3:1–16. doi: 10.1007/s100240050001. - DOI - PubMed
    1. Boyer JL. Bile duct epithelium: frontiers in transport physiology. Am J Physiol. 1996;270:G1–5. - PubMed
    1. Boyer JL. Bile secretion – models, mechanisms, and malfunctions. A perspective on the development of modern cellular and molecular concepts of bile secretion and cholestasis. J Gastroenterol. 1996;31:475–481. doi: 10.1007/BF02355044. - DOI - PubMed
    1. Chignard N, Mergey M, Veissiere D, Parc R, Capeau J, Poupon R, Paul A, Housset C. Bile acid transport and regulating functions in the human biliary epithelium. Hepatology. 2001;33:496–503. doi: 10.1053/jhep.2001.22345. - DOI - PubMed

LinkOut - more resources