. 2008 Oct;13(10):1046-54.
doi: 10.1634/theoncologist.2008-0075. Epub 2008 Oct 6.

Tumor growth rates derived from data for patients in a clinical trial correlate strongly with patient survival: a novel strategy for evaluation of clinical trial data

Affiliations

Tumor growth rates derived from data for patients in a clinical trial correlate strongly with patient survival: a novel strategy for evaluation of clinical trial data

Wilfred D Stein et al. Oncologist. 2008 Oct.

Abstract

Purpose: The slow progress in developing new cancer therapies can be attributed in part to the long time spent in clinical development. To hasten development, new paradigms especially applicable to patients with metastatic disease are needed.

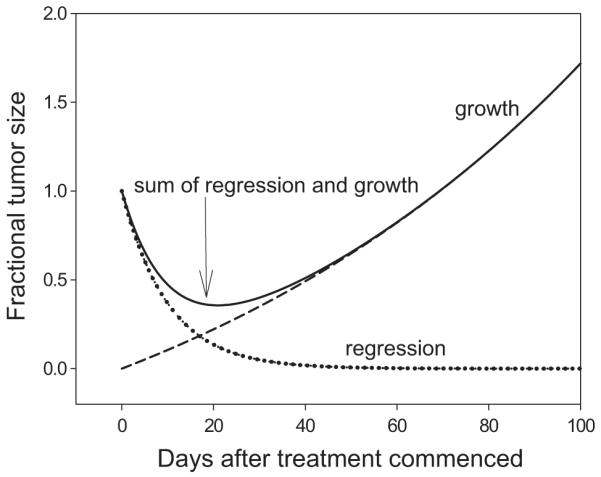
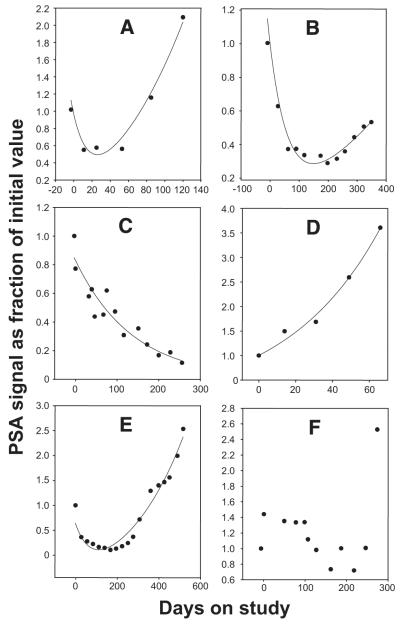
Patients and methods: We present a new method to predict survival using tumor measurement data gathered while a patient with cancer is receiving therapy in a clinical trial. We developed a two-phase equation to estimate the concomitant rates of tumor regression (regression rate constant d) and tumor growth (growth rate constant g).

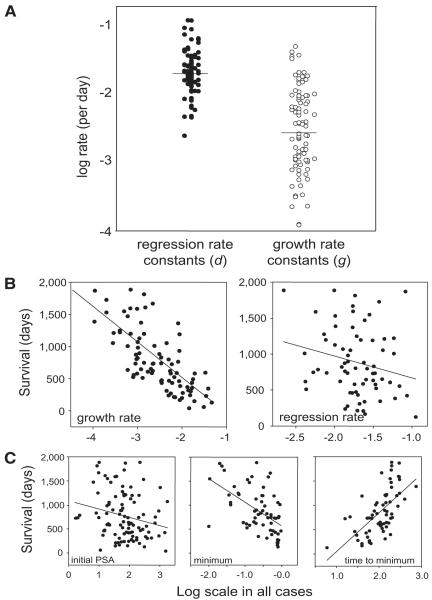
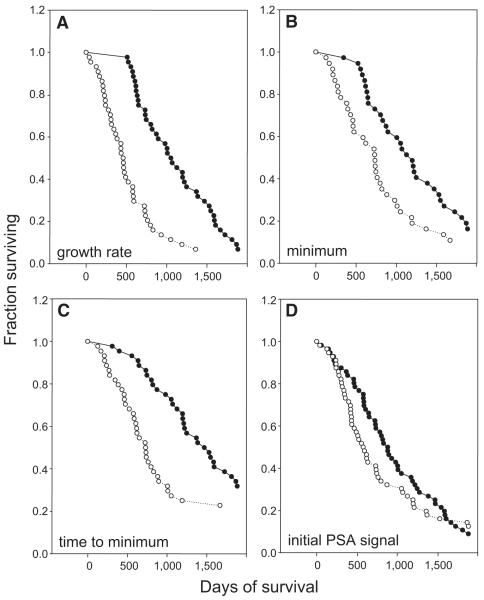
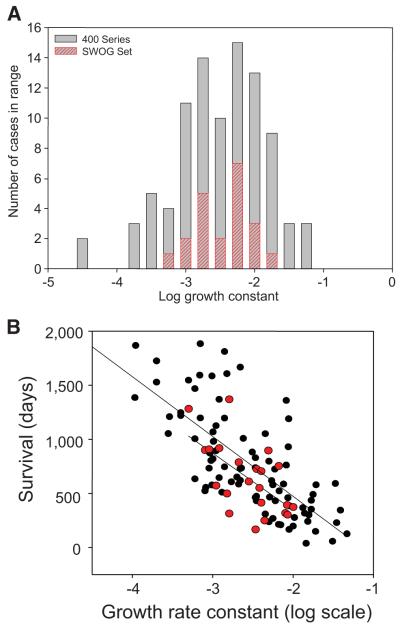
Results: We evaluated the model against serial levels of prostate-specific antigen (PSA) in 112 patients undergoing treatment for prostate cancer. Survival was strongly correlated with the log of the growth rate constant, log(g) (Pearson r = -0.72) but not with the log of the regression rate constants, log(d) (r = -0.218). Values of log(g) exhibited a bimodal distribution. Patients with log(g) values above the median had a mortality hazard of 5.14 (95% confidence interval, 3.10-8.52) when compared with those with log(g) values below the median. Mathematically, the minimum PSA value (nadir) and the time to this minimum are determined by the kinetic parameters d and g, and can be viewed as surrogates.

Conclusions: This mathematical model has applications to many tumor types and may aid in evaluating patient outcomes. Modeling tumor progression using data gathered while patients are on study, may help evaluate the ability of therapies to prolong survival and assist in drug development.


Figures

Figure 1
Figure 1
Theoretical plots for the regression– growth model. The dotted line labeled “regression” describes that fraction of the tumor that is regressing (decaying) during treatment. The line depicted is the prediction of this equation with parameter g set to zero (i.e., regression only). The dashed line labeled “growth” describes that fraction that begins at a negligible amount but grows continuously. The line depicted is the prediction of this equation with parameter d set to 0 (i.e., growth only). The solid line labeled “sum of regression and growth” gives the (net) sum of these two processes. The line depicted is the prediction of the full regression– growth model of equation (1) of the text, with rate constant g set at 100 per day and d set at 10 per day.
Figure 2
Figure 2
Prostate-specific antigen (PSA) level (as a fraction of the value at the start of treatment) against time in days for six patients of the 109 for whom sufficient data were available to attempt a full analysis. We excluded three patients for whom data from two or fewer time points were available, leaving 109 datasets to be analyzed. After inspection of the scatterplots for all 109 patients, we omitted six datapoints (one point from each of the six patient datasets, numbers 40, 44, 68, 93, 109, and 111) that were obvious outliers. The full set can be found in the supplementary material as online supplementary Figure S1. All patient data were normalized by dividing each PSA reading by the baseline PSA reading obtained at, or just before, the start of treatment. For 99, either g or d (or both) had an associated p < .05. Most of these 99 patients (n = 68) were characterized by a pattern of both regression and subsequent regrowth and fit equation (1). (A) and (B) are two cases in which the full equation (1) was applicable. Seven of the 99 showed no evidence of regrowth and their data fit equation (2), regression only (C), while 24 did not show a nadir and their data fit equation (3), growth only (D). Six patients (of the 68 patients whose PSA curve was characterized by a pattern of both regression and subsequent regrowth) showed evidence of delayed regrowth requiring application of equation (4) (E). For 10 individuals, the data showed much scatter and the model did not fit the observed data well (F). The lines drawn are the best-fit theoretical predictions of the appropriate equations. The derived parameters for g and d are provided in online supplementary Table 2.
Figure 3
Figure 3
Distribution of regression and growth rate constants and their correlations with survival. (A): Dotplots of the distribution of the best-fit regression rate constants (d, left panel) or growth rate constants (g, right panel). The horizontal line in each set is the median value. The ordinate is the logarithm of the derived rate constant. The abscissa has an arbitrary scale. We extracted the parameters g and d and their associated Student’s t-values and p-values. We declared significance at p<.05. When either g or d was not significant at this level, we used the respective reduced form of equation (1), namely, equation (2) or equation (3). For those cases in which the data obviously increased after the minimum and yet the derived value of g, using equation (1), was not significant, we tested whether application of equation (4) resulted in significant values for both g and d. (B and C): Dependence of patient survival (ordinates, in days) on five parameters that characterize the time course of the prostate-specific antigen (PSA) level. All abscissas are logarithmic scales. (B): Distributions of patient survival times and the two rate constants for the 99 patients in whom the PSA time courses had a g or d (or both) with an associated p<.05. Growth rate constants (g, per day) were derived using equation(1) or equation(3) and regression rate constants (d, per day) were derived using equation (1) or equation (2). Survival was more strongly correlated (Pearson’s r=−0.72; p<.0001; d.f.=84) with the logarithm of the growth rate constant than with the logarithm of the regression rate constant (r=−0.218; p=.074; d.f.=66). (C): Correlations between patient survival times and the initial PSA level in ng/ml (r=−0.22; p=.0257; d.f.=98), the minimum value of the PSA signal (min, nadir, as a fraction of the initial signal) (r=−0.54; p<.0001; d.f.=62), and the time to reach the minimum PSA value (tmin, in days) (r=0.62; p<.0001; d.f.=62). The lines drawn are the linear regressions with parameters as listed in the text. For those patients in whom the data demonstrated regression, we calculated min and tmin. For patients for whom g and d were both significant, min was determined by noting the point at which the PSA value first began to increase and then continued to do so for two subsequent time points, and tmin was the time of this minimum, or the mean of two time points if the minimum value was identical at two time points. For those cases in which the signal decreased continuously, min was the lowest value reached during the study and tmin was the first time this value was reached.
Figure 4
Figure 4
Kaplan–Meier plots of fractional survival against survival time for the upper and lower 50% of cases, in each case stratified by log(g), min, tmin, and the initial PSA value. The ordinate is the fraction of patients in each group still surviving, while the abscissa is days. (A): Patients whose tumor growth rate constants were in the upper 50% had shorter survival times (hazard ratio [HR], 5.14; 95% confidence interval [CI], 3.10–8.52) than patients whose tumor growth rate constants were in the lower 50%. (B): The nadir or minimum (min, nadir) had a strong impact on survival (HR, 2.59; 95% CI, 1.54 – 4.380, comparing the upper 50% with the lower 50%). (C): The time to the minimum (tmin) PSA level also had a strong impact on survival (HR, 3.17; 95% CI, 1.83–5.48, comparing the upper 50% with the lower 50%). (D): An initial PSA signal in the upper 50% had a small, but statistically significant, impact on survival (HR, 1.74; 95% CI, 1.19–2.64, as compared to the lower 50%). See note in Figure 3 regarding min and tmin.
Figure 5
Figure 5
Histograms of growth rate constants. The validation set consists of data from 42 patients with metastatic prostate cancer treated with ixabepilone (BMS-247550, an epothilone B analogue). (A): Histogram of the distribution of values of the derived growth rate constant g (92 of the 99 patients are depicted because in seven no growth was observed and only the regression rate constant, d, could be calculated). The red-shaded columns depict the distribution for the growth rate constants derived for the validation set. (B): The dependence of patient survival (ordinate, in days) on the values of the derived growth rate constants (abscissa, g, per day) for the full dataset of our study group (black solid symbols) and the validation set (red symbols). The lines drawn are the linear regressions for each set separately. The shorter lower line depicts the regression through the data obtained from the validation set. A second line superimposed on the upper longer line represents the line obtained when data from both groups were analyzed together. Neither the slope of these lines nor their intercepts are statistically different from the line above representing the study group. As in the study group, 13 patients in the validation group whose prostate-specific antigen values only fell during the period of observation, and hence had only “regression curves,” were excluded because (as discussed in the methods section) there was no possibility of calculating a meaningful growth rate constant from the available data. Among the remaining 29 patients, six had too few datapoints or a too scattered dataset for analysis. The remaining 23 had data that yielded growth rate constants with a p-value < .05 in 21 and < .075 in two.

Comment in

References

    1. Adams J. The development of proteasome inhibitors as anticancer drugs. Cancer Cell. 2004;5:417–421. - PubMed
    1. Sharifi N, Gulley JL, Dahut WL. Androgen deprivation therapy for prostate cancer. JAMA. 2005;294:238–244. - PubMed
    1. Petrylak D. Therapeutic options in androgen-independent prostate cancer: Building on docetaxel. BJU Int. 2005;96(suppl 2):41–46. - PubMed
    1. Pienta KJ, Bradley D. Mechanisms underlying the development of androgen-independent prostate cancer. Clin Cancer Res. 2006;12:1665–1671. - PubMed
    1. Silvestris N, Leone B, Numico G, et al. Present status and perspectives in the treatment of hormone-refractory prostate cancer. Oncology. 2005;69:273–282. - PubMed

Publication types

Substances