

Temperature increase of 21st century mitigation scenarios
- PMID: 18838680
- PMCID: PMC2562414
- DOI: 10.1073/pnas.0711129105
Temperature increase of 21st century mitigation scenarios
Abstract
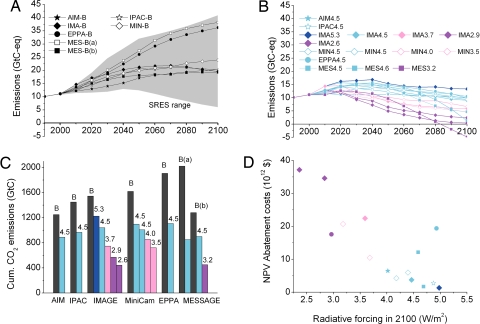
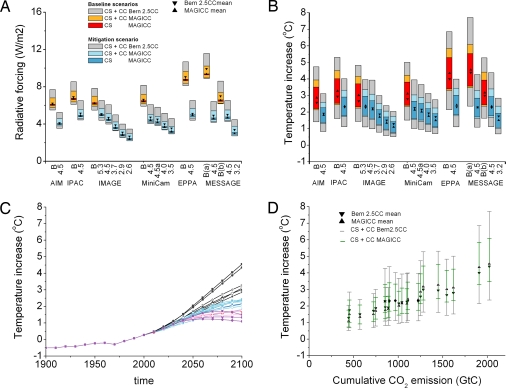
Estimates of 21st Century global-mean surface temperature increase have generally been based on scenarios that do not include climate policies. Newly developed multigas mitigation scenarios, based on a wide range of modeling approaches and socioeconomic assumptions, now allow the assessment of possible impacts of climate policies on projected warming ranges. This article assesses the atmospheric CO(2) concentrations, radiative forcing, and temperature increase for these new scenarios using two reduced-complexity climate models. These scenarios result in temperature increase of 0.5-4.4 degrees C over 1990 levels or 0.3-3.4 degrees C less than the no-policy cases. The range results from differences in the assumed stringency of climate policy and uncertainty in our understanding of the climate system. Notably, an average minimum warming of approximately 1.4 degrees C (with a full range of 0.5-2.8 degrees C) remains for even the most stringent stabilization scenarios analyzed here. This value is substantially above previously estimated committed warming based on climate system inertia alone. The results show that, although ambitious mitigation efforts can significantly reduce global warming, adaptation measures will be needed in addition to mitigation to reduce the impact of the residual warming.
Conflict of interest statement
The authors declare no conflict of interest.
Figures
References
-
- Solomon S, et al. Climate Change 2007: The Physical Science Basis. Contribution of Working Group I to the Fourth Assessment. Cambridge, UK: Cambridge Univ Press; 2007.
-
- Nakicenovic N, Swart R. Special Report on Emissions Scenarios (SRES) Cambridge, UK: Cambridge Univ Press; 2000.
-
- Cubash U, Meehl GA. In: Climate Change 2001: The Scientific Basis. Houghton JT, et al., editors. Cambridge, UK: Cambridge Univ Press; 2001.
-
- Joos F, et al. Global warming feedbacks on terrestrial carbon uptake under the Intergovernmental Panel on Climate Change (IPCC) emission scenarios. Global Biogeochem Cycles. 2001;15:891–907.
-
- Wigley TML, Raper SCB. Interpretation of high projections for global-mean warming. Science. 2001;293:451–454. - PubMed
MeSH terms
Substances
LinkOut - more resources
Full Text Sources
