. 2008 Oct 14;105(41):15803-8.
doi: 10.1073/pnas.0808249105. Epub 2008 Oct 6.

Dephosphorylation by calcineurin regulates translocation of Drp1 to mitochondria

Affiliations

Dephosphorylation by calcineurin regulates translocation of Drp1 to mitochondria

G M Cereghetti et al. Proc Natl Acad Sci U S A. .

Abstract

Changes in mitochondrial morphology that occur during cell cycle, differentiation, and death are tightly regulated by the balance between fusion and fission processes. Excessive fragmentation can be caused by inhibition of the fusion machinery and is a common consequence of dysfunction of the organelle. Here, we show a role for calcineurin-dependent translocation of the profission dynamin related protein 1 (Drp1) to mitochondria in dysfunction-induced fragmentation. When mitochondrial depolarization is associated with sustained cytosolic Ca(2+) rise, it activates the cytosolic phosphatase calcineurin that normally interacts with Drp1. Calcineurin-dependent dephosphorylation of Drp1, and in particular of its conserved serine 637, regulates its translocation to mitochondria as substantiated by site directed mutagenesis. Thus, fragmentation of depolarized mitochondria depends on a loop involving sustained Ca(2+) rise, activation of calcineurin, and dephosphorylation of Drp1 and its translocation to the organelle.


Conflict of interest statement

The authors declare no conflict of interest.

Figures
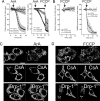
Fig. 1.
Fig. 1.
Mitochondrial depolarization causes Drp1-dependent fission. (A and B) Changes in mitochondrial fluorescence of TMRM or calcein. HeLa cells loaded with calcein/Co2+ or with TMRM were treated where indicated (arrows) with 20 μM ArA (A) or 2 μM FCCP (B). Fluorescence intensities were normalized to the initial value for comparative reasons. Data represent mean ± SE of four independent experiments. Where indicated, cells were pretreated with CsA or with the inactive analogue CsH (18). (C and D) Representative confocal images of mtRFP fluorescence in HeLa cells before (left) or 30 min after (right) treatment with 20 μM ArA (C) or 2 μM FCCP (D). Where indicated, cells were pretreated with CsA or cotransfected with K38A Drp1 (Drp1DN) (Scale bar, 20 μm).
Fig. 2.
Fig. 2.
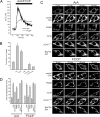
Inhibition of calcineurin blocks mitochondrial fission by ArA and FCCP. (A) Representative traces of cytosolic Ca2+ ([Ca2+]i) as measured by Fura-2 in HeLa cells treated where indicated with 20 μM ArA or 2 μM FCCP. (B) Calcineurin activity measured in cytosolic extracts of HeLa cells treated where indicated for 15 min with 20 μM ArA or 2 μM FCCP. Where indicated, cells were pretreated with 2 μM CsA for 30 min. Data are compared with the activity of untreated cells set as 100% and represent mean ± SE of four independent experiments. (C) Representative frames acquired at indicated times from real time confocal imaging of HeLa cells transfected with mtRFP. At t = 3 min, cells were treated as indicated with 20 μM ArA or 2 μM FCCP. Where indicated, cells were pretreated for 30 min with 2 μM mMeValCsA, 0.6 μM FK506 or 40 μM BAPTA-AM, or cotransfected with CnB plus ΔCnA or ΔCnAH151Q. Bar, 20 μm. (D) Quantitative analysis of mitochondrial shape changes. Experiments were performed exactly as in (C). Morphometry was performed as described. Data represent mean ± SE of 8 different experiments. In each experiment, 20 cells were scored. In the case of BAPTA-AM, no fragmentation could be detected in the timeframe of the experiment.
Fig. 3.
Fig. 3.
Dephosphorylated Drp1 accumulates on mitochondria. (A) Equal amounts of HeLa cell proteins (100 μg) dissolved in CPBS were immunoprecipitated with the indicated antibodies and proteins in the lysates (Input, 1:5 dilution) and coprecipitated proteins were separated by SDS/PAGE and immunoblotted with the indicated antibodies. (B) Lysates from HeLa cells treated where indicated with 20 μM ArA or 2 μM FCCP for 15 min were prepared and equal amounts of protein (100 μg) dissolved in CPBS buffer were immunoprecipitated with an anti-Drp1 antibody. Coprecipitated proteins were analyzed by SDS/PAGE and immunoblotting with the indicated antibodies. Where indicated, cells were pretreated for 30 min with 2 μM mMeValCsA or 0.6 μM FK506. Input represents a 1:5 dilution of the total lysates. (C) Subcellular fractions of HeLa cells treated where indicated with 20 μM ArA for 15 min were prepared and equal amounts (40 μg) of protein from total, cytosolic and mitochondrial fractions were separated by SDS/PAGE and immunoblotted using the indicated antibodies. LDH, lactate dehydrogenase; MnSOD, Mn-dependent superoxide dismutase. (D) Experiments were preformed as in (C), except that cytosolic and mitochondrial fractions were loaded on a column binding phosphorylated proteins to separate phosphorylated and unphosphorylated proteins. Thirty μg of total (tot), phosphorylated (P) and unphosphorylated (nP) proteins from each fraction were separated by SDS/PAGE and immunoblotted using an anti-Drp1 antibody.
Fig. 4.
Fig. 4.
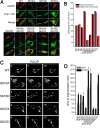
Translocation of Drp1 to mitochondria is controlled by Serine 637. (A) Representative confocal images of HeLa cells cotransfected with mtRFP and the indicated Drp1-YFP mutants. Bar, 20 μm. (B) Analysis of subcellular localization of Drp1-YFP. Experiments were exactly as in (A). Classification of subcellular distribution of Drp1-YFP and mitochondrial morphometric analysis was performed as described in SI Experimental Procedures. Sixty to eighty cells were scored in each condition. (C) Representative frames acquired at indicated times from real time confocal imaging of HeLa cells cotransfected with mtRFP and the indicated mutants of Drp1-YFP. At t = 3 min, cells were treated with 2 μM FCCP. (D) Quantitative analysis of mitochondrial shape changes. Experiments were exactly as in C, except that after 3 min cells were treated with 20 μM ArA or 2 μM FCCP as indicated. Morphometric analysis was performed as described. Data represent mean ± SE of four different experiments. In each experiment, 10 cells were scored.

References

    1. Meeusen SL, Nunnari J. How mitochondria fuse. Curr Opin Cell Biol. 2005;17:389–394. - PubMed
    1. McBride HM, Neuspiel M, Wasiak S. Mitochondria: More than just a powerhouse. Curr Biol. 2006;16:R551–R560. - PubMed
    1. Pellegrini L, Scorrano L. A cut short to death: Parl and Opa1 in the regulation of mitochondrial morphology and apoptosis. Cell Death Differ. 2007;14:1275–1284. - PubMed
    1. Okamoto K, Shaw JM. Mitochondrial morphology and dynamics in yeast and multicellular eukaryotes. Annu Rev Genet. 2005;39:503–536. - PubMed
    1. Alto NM, Soderling J, Scott JD. Rab32 is an A-kinase anchoring protein and participates in mitochondrial dynamics. J Cell Biol. 2002;158:659–668. - PMC - PubMed

Publication types