Meta-Analysis
. 2008 Oct 7;149(7):461-71, W83-8.
doi: 10.7326/0003-4819-149-7-200810070-00006.

Insulin-like growth factors, their binding proteins, and prostate cancer risk: analysis of individual patient data from 12 prospective studies

Affiliations
Meta-Analysis

Insulin-like growth factors, their binding proteins, and prostate cancer risk: analysis of individual patient data from 12 prospective studies

Andrew W Roddam et al. Ann Intern Med. .

Abstract

Background: Some, but not all, published results have shown an association between circulating blood levels of some insulin-like growth factors (IGFs) and their binding proteins (IGFBPs) and the subsequent risk for prostate cancer.

Purpose: To assess the association between levels of IGFs and IGFBPs and the subsequent risk for prostate cancer.

Data sources: Studies identified in PubMed, Web of Science, and CancerLit.

Study selection: The principal investigators of all studies that published data on circulating concentrations of sex steroids, IGFs, or IGFBPs and prostate cancer risk using prospectively collected blood samples were invited to collaborate.

Data extraction: Investigators provided individual participant data on circulating concentrations of IGF-I, IGF-II, IGFBP-II, and IGFBP-III and participant characteristics to a central data set in Oxford, United Kingdom.

Data synthesis: The study included data on 3700 men with prostate cancer and 5200 control participants. On average, case patients were 61.5 years of age at blood collection and received a diagnosis of prostate cancer 5 years after blood collection. The greater the serum IGF-I concentration, the greater the subsequent risk for prostate cancer (odds ratio [OR] in the highest vs. lowest quintile, 1.38 [95% CI, 1.19 to 1.60]; P < 0.001 for trend). Neither IGF-II nor IGFBP-II concentrations were associated with prostate cancer risk, but statistical power was limited. Insulin-like growth factor I and IGFBP-III were correlated (r = 0.58), and although IGFBP-III concentration seemed to be associated with prostate cancer risk, this was secondary to its association with IGF-I levels. Insulin-like growth factor I concentrations seemed to be more positively associated with low-grade than high-grade disease; otherwise, the association between IGFs and IGFBPs and prostate cancer risk had no statistically significant heterogeneity related to stage or grade of disease, time between blood collection and diagnosis, age and year of diagnosis, prostate-specific antigen level at recruitment, body mass index, smoking, or alcohol intake.

Limitations: Insulin-like growth factor concentrations were measured in only 1 sample for each participant, and the laboratory methods to measure IGFs differed in each study. Not all patients had disease stage or grade information, and the diagnosis of prostate cancer may differ among the studies.

Conclusion: High circulating IGF-I concentrations are associated with a moderately increased risk for prostate cancer.


Conflict of interest statement

Potential Financial Conflicts of Interest: None disclosed.

Figures

Figure 1
Figure 1. Association of prostate cancer risk with increasing quintiles of insulin-like growth factors (IGFs) and their main binding protein concentrations
IGFBP = insulin-like growth factor binding protein. * All odds ratios (ORs) are unadjusted except for factors controlled for by stratification (study, age, and year of recruitment). The position of each square indicates the magnitude of the OR, and the area of the square is proportional to the amount of statistical information available (inverse of the variance of the logarithm of the OR). The horizontal line indicates the 95% CI. † Chi-square statistic for linear trend, calculated by replacing the categorical variables with a variable that was scored as 0, 0.25, 0.5, 0.75, and 1.
Figure 2
Figure 2. Association of prostate cancer risk with insulin-like growth factor I concentration, by study
For expansion of study names, see Table 1. * All odds ratios (ORs) are unadjusted except for factors controlled for by stratification (study, age, and year of recruitment). The OR is the estimate of the linear trend for insulin-like growth factor I obtained by replacing the categorical variable with a variable that was scored as 0, 0.25, 0.5, 0.75, and 1. The position of each square indicates the magnitude of the OR, and the area of the square is proportional to the amount of statistical information available (inverse of the variance of the logarithm of the OR). The horizontal line indicates the 95% CI. The dashed line represents the all-studies OR. † Heterogeneity between studies was assessed by using the chi-square statistic, which tested whether the study-specific results statistically significantly differed from the overall result. The P value for statistical significance of the chi-square statistic is 2-sided. Heterogeneity was also quantified by using the H and I2 statistics.
Figure 3
Figure 3. Association of prostate cancer risk with insulin-like growth factor binding protein III concentration, by study
For expansion of study names, see Table 1. * All odds ratios (ORs) are unadjusted except for factors controlled for by stratification (study, age, and year of recruitment). The OR is the estimate of the linear trend for insulin-like growth factor binding protein III obtained by replacing the categorical variable with a variable that was scored as 0, 0.25, 0.5, 0.75, and 1. The position of each square indicates the magnitude of the OR, and the area of the square is proportional to the amount of statistical information available (inverse of the variance of the logarithm of the OR). The horizontal line indicates the 95% CI. The dashed line represents the all-studies OR. † Heterogeneity between studies was assessed by using the chi-square statistic, which tested whether the study-specific results statistically significantly differed from the overall result. The P value for statistical significance of the chi-square statistic is 2-sided. Heterogeneity was also quantified by using the H and I2 statistics.
Figure 4
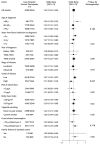
Figure 4. Association of prostate cancer risk with insulin-like growth factor I concentration, by tumor and participant characteristics
* All odds ratios (ORs) are unadjusted except for factors controlled for by stratification (study, age, and year of recruitment). The OR is the estimate of the linear trend for insulin-like growth factor I obtained by replacing the categorical variable with a variable that was scored as 0, 0.25, 0.5, 0.75, and 1. The position of each square indicates the magnitude of the OR, and the area of the square is proportional to the amount of statistical information available (inverse of the variance of the logarithm of the OR). The horizontal line indicates the 95% CI. The dashed line represents the all-studies OR. † P value from a chi-square test for heterogeneity to assess whether the OR estimates for each characteristic differ from each other.
Appendix Figure 1
Appendix Figure 1. Association of prostate cancer risk with insulin-like growth factor II concentration, by study
For expansion of study names, see Table 1. * All odds ratios (ORs) are unadjusted except for factors controlled for by stratification (study, age, and year of recruitment). The OR is the estimate of the linear trend for insulin-like growth factor II obtained by replacing the categorical variable with a variable that was scored as 0, 0.25, 0.5, 0.75, and 1. The position of each square indicates the magnitude of the OR, and the area of the square is proportional to the amount of statistical information available (inverse of the variance of the logarithm of the OR). The horizontal line indicates the 95% CI. The dashed line represents the all-studies OR. † Heterogeneity among studies was assessed by using a chi-square statistic that tested whether the study-specific results statistically significantly differed from the overall result. The P value for statistical significance of the chi-square statistic is 2-sided. Heterogeneity was also quantified by using the H and I2 statistics.
Appendix Figure 2
Appendix Figure 2. Association of prostate cancer risk with insulin-like growth factor binding protein II concentration, by study
For expansion of study names, see Table 1. * All odds ratios (ORs) are unadjusted except for factors controlled for by stratification (study, age, and year of recruitment). The OR is the estimate of the linear trend for insulin-like growth factor binding protein II obtained by replacing the categorical variable with a variable that was scored as 0, 0.25, 0.5, 0.75, and 1. The position of each square indicates the magnitude of the OR, and the area of the square is proportional to the amount of statistical information available (inverse of the variance of the logarithm of the OR). The horizontal line indicates the 95% CI. The dashed line represents the all-studies OR. † Heterogeneity among studies was assessed by using a chi-square statistic that tested whether the study-specific results statistically significantly differed from the overall result. The P value for statistical significance of the chi-square statistic is 2-sided. Heterogeneity was also quantified by using the H and I2 statistics.
Appendix Figure 3
Appendix Figure 3. Association of prostate cancer risk with insulin-like growth factor II concentration, by tumor and participant characteristics
* All odds ratios (ORs) are unadjusted except for factors controlled for by stratification (study, age, and year of recruitment).The OR is the estimate of the linear trend for insulin-like growth factor II obtained by replacing the categorical variable with a variable that was scored as 0, 0.25, 0.5, 0.75, and 1. The position of each square indicates the magnitude of the OR, and the area of the square is proportional to the amount of statistical information available (inverse of the variance of the logarithm of the OR). The horizontal line indicates the 95% CI. The dashed line represents the all-studies OR. † P value from a chi-square test for heterogeneity to assess whether the OR estimates for each characteristic differed from each other.
Appendix Figure 4
Appendix Figure 4. Association of prostate cancer risk with insulin-like growth factor binding protein II concentration, by tumor and participant characteristics
* All odds ratios (ORs) are unadjusted except for factors controlled for by stratification (study, age, and year of recruitment). The OR is the estimate of the linear trend for insulin-like growth factor binding protein II obtained by replacing the categorical variable with a variable that was scored as 0, 0.25, 0.5, 0.75, and 1. The position of each square indicates the magnitude of the OR, and the area of the square is proportional to the amount of statistical information available (inverse of the variance of the logarithm of the OR). The horizontal line indicates the 95% CI. The dashed line represents the all-studies OR. † P value from a chi-square test for heterogeneity to assess whether the OR estimates for each characteristic differed from each other.
Appendix Figure 5
Appendix Figure 5. Association of prostate cancer risk with insulin-like growth factor binding protein III concentration, by tumor and participant characteristics
* All odds ratios (ORs) are unadjusted except for factors controlled for by stratification (study, age, and year of recruitment). The OR is the estimate of the linear trend for insulin-like growth factor binding protein III obtained by replacing the categorical variable with a variable that was scored as 0, 0.25, 0.5, 0.75, and 1. The position of each square indicates the magnitude of the OR, and the area of the square is proportional to the amount of statistical information available (inverse of the variance of the logarithm of the OR). The horizontal line indicates the 95% CI. The dashed line represents the all-studies OR. †P value from a chi-square test for heterogeneity to assess whether the OR estimates for each characteristic differed from each other.

References

    1. Ferlay J, Bray F, Pisani P, Parkin DM. IARC CancerBase no 5, version 2.0. Lyon: IARC Pr; 2004. GLOBOCAN 2002: cancer incidence, mortality and prevalence worldwide.
    1. Bostwick DG, Burke HB, Djakiew D, Euling S, Ho SM, Landolph J, et al. Human prostate cancer risk factors. Cancer. 2004;101:2371–490. [PMID: 15495199] - PubMed
    1. Jones JI, Clemmons DR. Insulin-like growth factors and their binding proteins: biological actions. Endocr Rev. 1995;16:3–34. [PMID: 7758431] - PubMed
    1. Renehan AG, Zwahlen M, Minder C, O'Dwyer ST, Shalet SM, Egger M. Insulin-like growth factor (IGF)-I, IGF binding protein-3, and cancer risk: systematic review and meta-regression analysis. Lancet. 2004;363:1346–53. [PMID: 15110491] - PubMed
    1. Chan JM, Stampfer MJ, Ma J, Gann P, Gaziano JM, Pollak M, et al. Insulin-like growth factor-I (IGF-I) and IGF binding protein-3 as predictors of advanced-stage prostate cancer. J Natl Cancer Inst. 2002;94:1099–106. [PMID: 12122101] - PubMed

Publication types

MeSH terms

Substances