. 2008 Oct 30;112(43):10939-48.
doi: 10.1021/jp8058239. Epub 2008 Oct 8.

Changes in water structure induced by the guanidinium cation and implications for protein denaturation

Affiliations

Changes in water structure induced by the guanidinium cation and implications for protein denaturation

J Nathan Scott et al. J Phys Chem A. .

Abstract

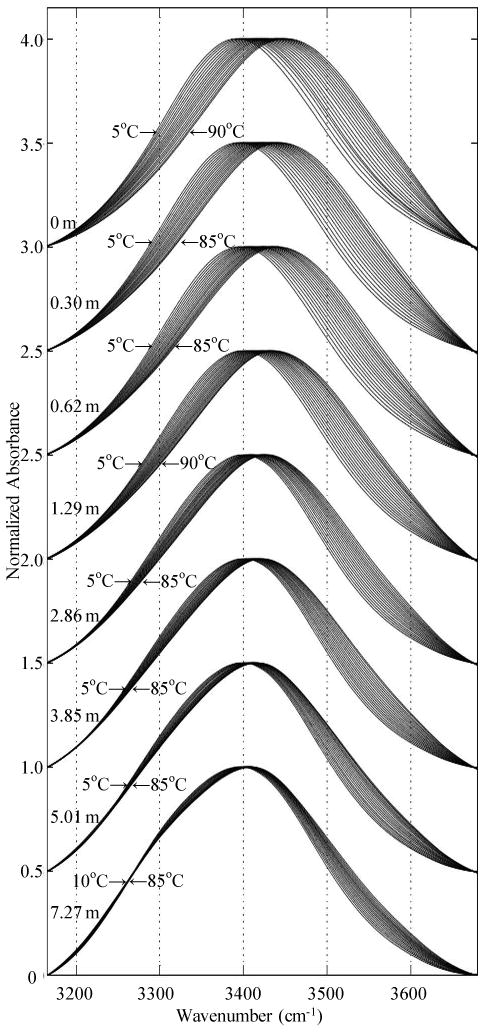
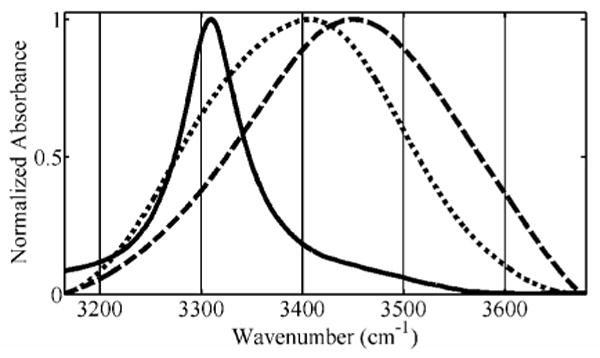
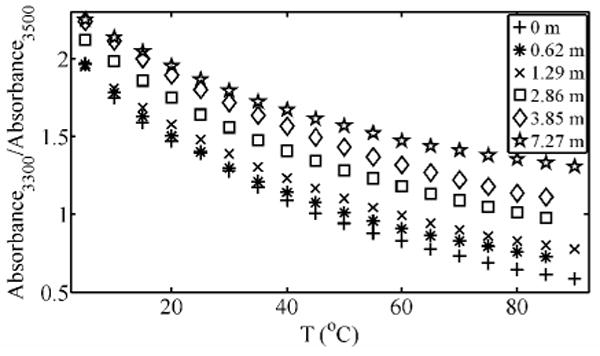
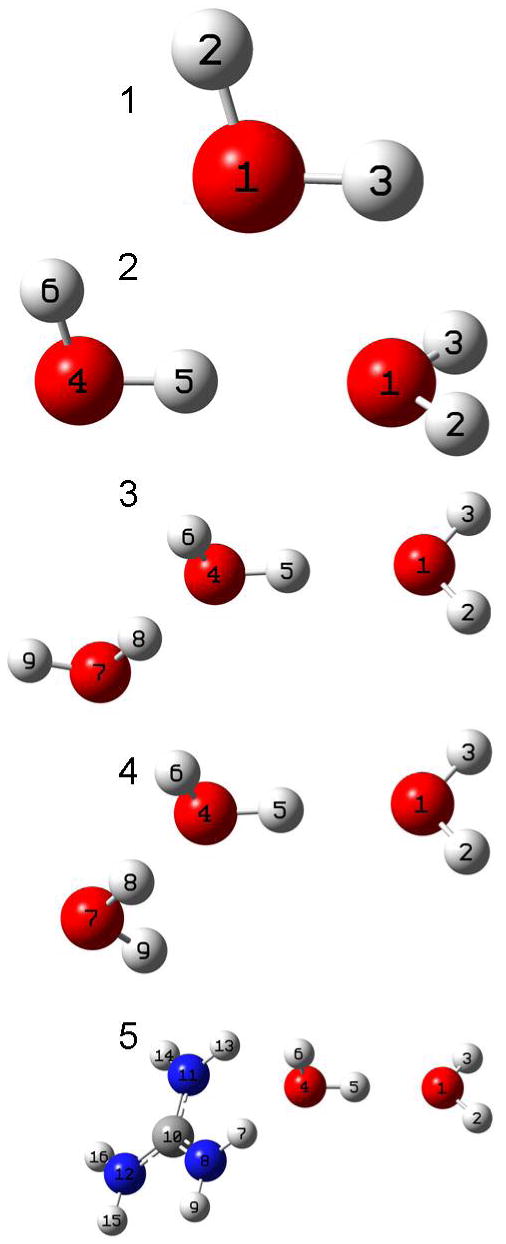
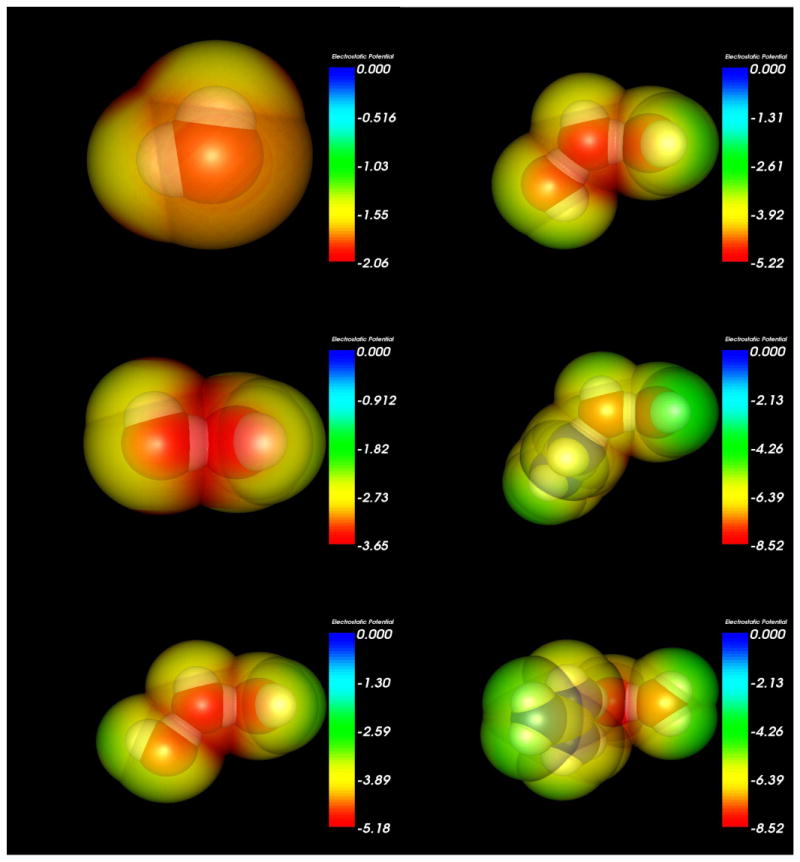
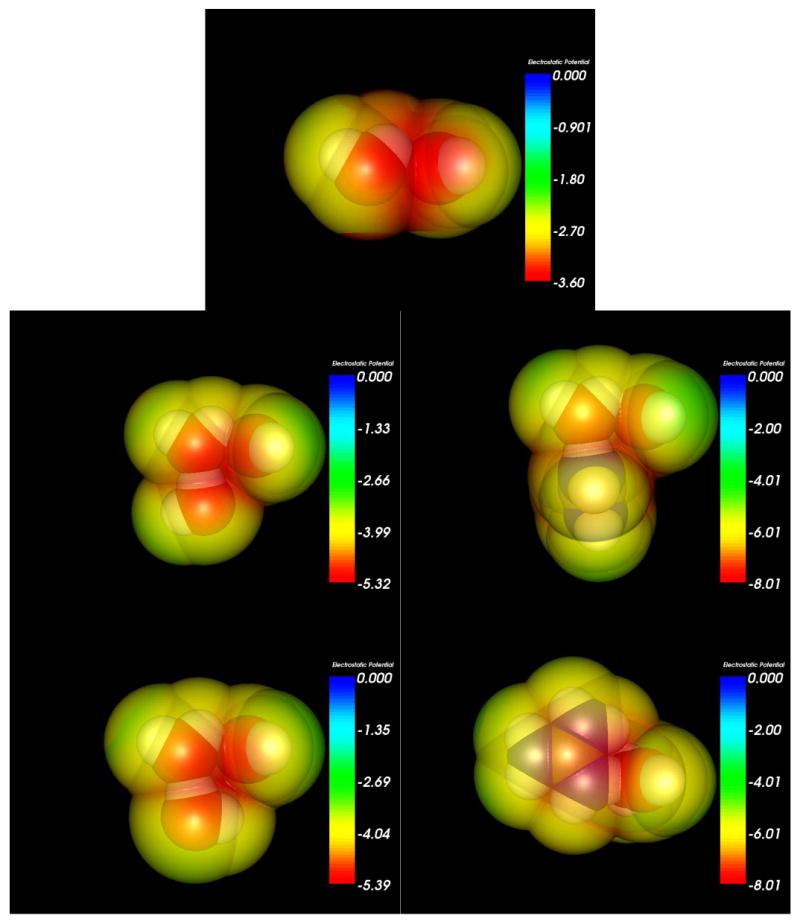
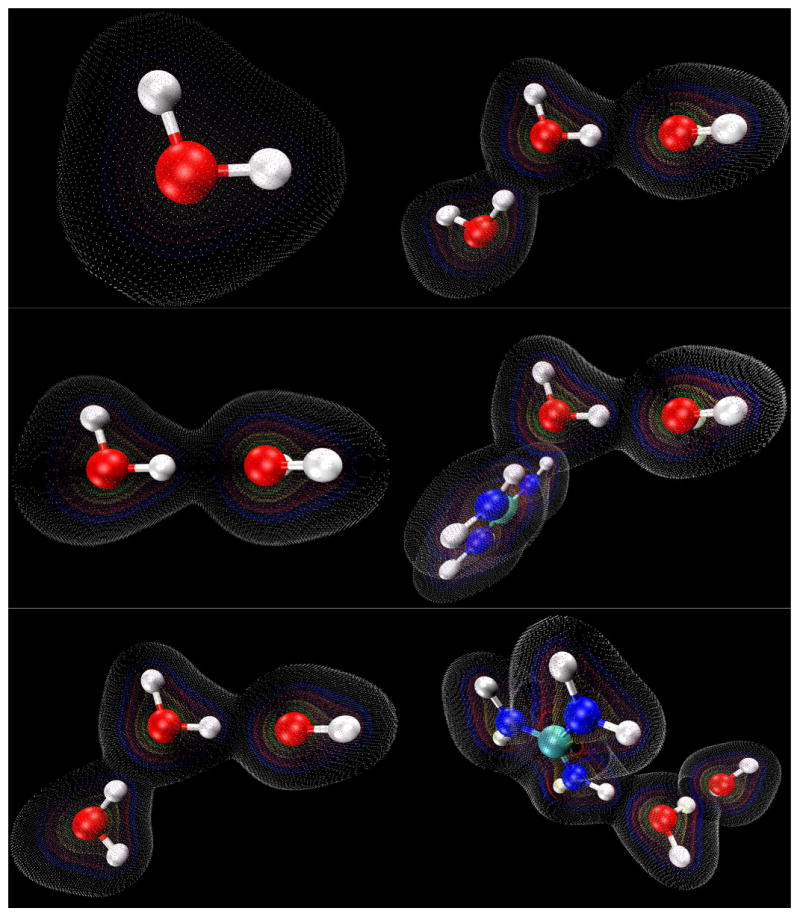
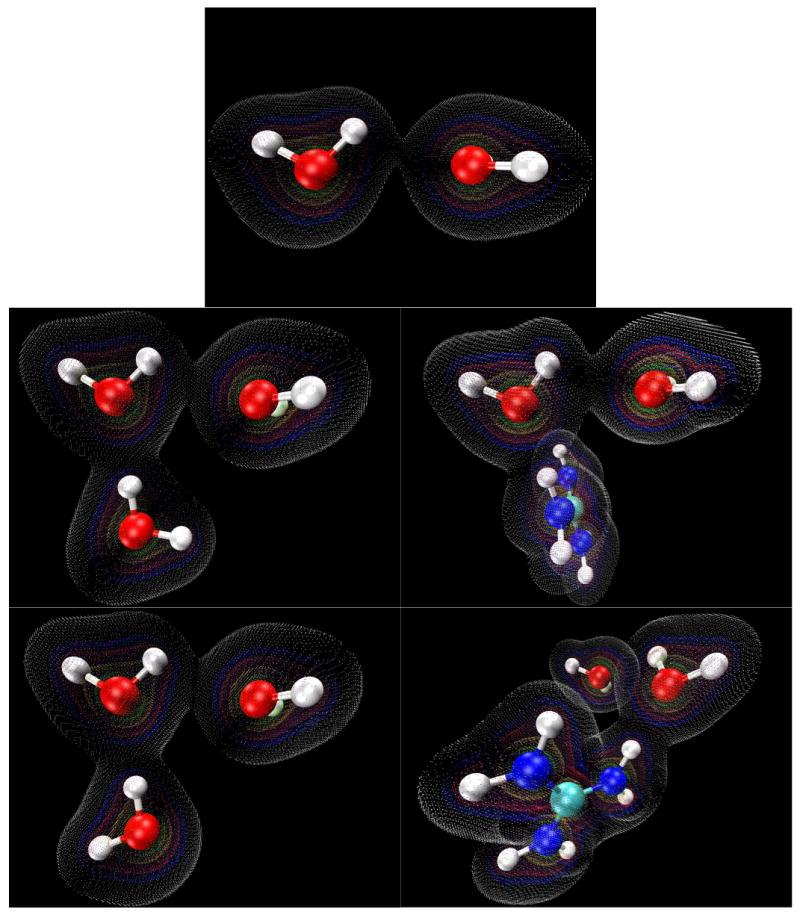
The effect of the guanidinium cation on the hydrogen bonding strength of water was analyzed using temperature-excursion Fourier transform infrared spectra of the OH stretching vibration in 5% H 2O/95% D 2O solutions containing a range of different guanidine-HCl and guanidine-HBr concentrations. Our findings indicate that the guanidinium cation causes the water H-bonds in solution to become more linear than those found in bulk water, and that it also inhibits the response of the H-bond network to increased temperature. Quantum chemical calculations also reveal that guanidinium affects both the charge distribution on water molecules directly H-bonded to it as well as the OH stretch frequency of H-bonds in which that water molecule is the donor. The implications of our findings to hydrophobic solvation and protein denaturation are discussed.


Figures

Figure 1
Figure 1
OH stretch TEIR spectra for 5% H2O / 95% D2O solutions containing increasing concentrations of guanidinium chloride.
Figure 2
Figure 2
OH stretch spectra of 7.27 m Gdm+/Br- (dot) and 5% H2O / 95% D2O water (dash) at 90°C shown, along with 5% H2O / 95% D2O ice at -10°C (solid).
Figure 3
Figure 3
Ratio of spectral intensities at 3300 cm-1 and 3500 cm-1 for selected Gdm+/Cl- OH stretch spectra shown in Figure 1.
Figure 4
Figure 4
Shown here are graphical representations of the systems for which the OH stretch frequency and natural population charges were calculated. Calculations were also performed for a variation on these systems in which the HOO angle (H5-O4-O1) was set at 45°. From top to bottom, the monomer, dimer, trimer (H up orientation), trimer (H down orientation), and guandinium – water dimer geometries are shown, along with a numerical key to referencing the tables 1 – 4.
Figure 5
Figure 5
Electrostatic potential maps at the solvent accessible surface (1.4 Å solvent radius probe) generated for the water monomer and linear molecular configurations using Molekel 5.3.0.6 and colored by molecular electrostatic potential.
Figure 6
Figure 6
Electrostatic potential maps at the solvent accessible surface (1.4 Å solvent radius probe) generated for the 45° HOO (H5-O4-O1) H-bond angle molecular configurations using Molekel 5.3.0.6 and colored by molecular electrostatic potential.
Figure 7
Figure 7
Electron density maps generated for the water monomer and linear molecular configurations using VMD 1.8.6. Contours are shown at values of 0.01 (white), 0.05 (blue), 0.10 (red), 0.25 (yellow), 0.50 (green).
Figure 8
Figure 8
Electron density maps generated for the 45° HOO (H5-O4-O1) H-bond angle molecular configurations using VMD 1.8.6. Contours are shown at values of 0.01 (white), 0.05 (blue), 0.10 (red), 0.25 (yellow), 0.50 (green).

References

    1. Svedberg T. Nature (London, U K) 1937;139:1051–62.
    1. Pace CN. Methods Enzymol. 1986;131:266–80. - PubMed
    1. Greenstein JP. J Biol Chem. 1938;125:501–13.
    1. Neurath H, Cooper GR, Erickson JO. J Biol Chem. 1942;142:249–63.
    1. Schellman JA. Biophys Chem. 2002;96:91–101. - PubMed

Publication types