

doi: 10.1186/gb-2008-9-10-r147.
Tools for simulating evolution of aligned genomic regions with integrated parameter estimation
Affiliations
- PMID: 18840304
- PMCID: PMC2760874
- DOI: 10.1186/gb-2008-9-10-r147
Item in Clipboard
Tools for simulating evolution of aligned genomic regions with integrated parameter estimation
Genome Biol.
.
Abstract
Controlled simulations of genome evolution are useful for benchmarking tools. However, many simulators lack extensibility and cannot measure parameters directly from data. These issues are addressed by three new open-source programs: GSIMULATOR (for neutrally evolving DNA), SIMGRAM (for generic structured features) and SIMGENOME (for syntenic genome blocks). Each offers algorithms for parameter measurement and reconstruction of ancestral sequence. All three tools out-perform the leading neutral DNA simulator (DAWG) in benchmarks. The programs are available at http://biowiki.org/SimulationTools.
Figures
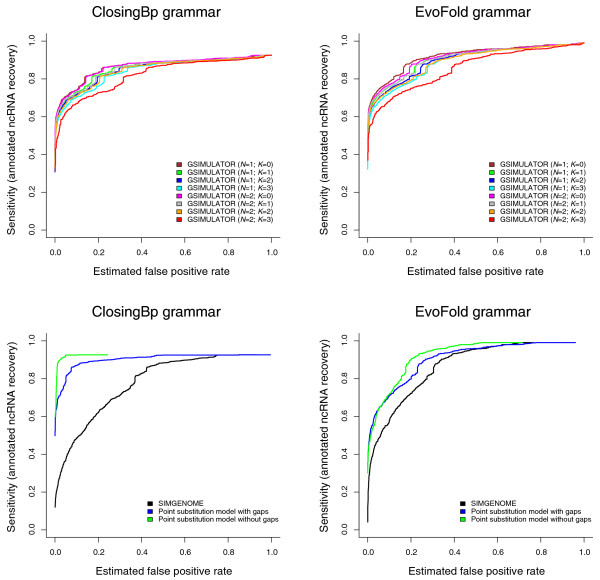
Receiver operating characteristic (ROC) curves for two non-coding RNA prediction algorithms, ClosingBp (Bradley RK, Uzilov AV, Skinner M, Bendaña YR, Barquist L and Holmes I, submitted) and EVOFOLD [39] (implemented using XRATE), using GSIMULATOR and SIMGENOME models to estimate the false positive discovery rate. These curves illustrate the general principle that the more realistic a simulation model, the higher the estimated false positive rate (FPR). This trend is independent of the gene-prediction algorithm used. The upper panes show results for GSIMULATOR: it is seen that more complex indel length distributions (N) and, in particular, context-dependence (K) both increase the FPR. The lower panes show results for SIMGENOME and component models, where the FPR is increased by including gaps (which amplify fluctuations in information content, due to their typically being treated as 'missing information') and genomic features (some of which evolve at a slower rate than neutral sequence). The reason that the asymptotic sensitivity is less than 1.0 is that our benchmark used a sliding-window approach, predicting at most one non-coding RNA (ncRNA) in each window. Our set of real ncRNAs was taken from multi-genome Drosophila alignments produced by the PECAN program [50]; in each case, to ensure a fair comparison, we took a window of the PECAN alignment surrounding the annotated ncRNA, with the size of this window matching the size of the sliding-window that was used on the simulated null data. Some of the positive ncRNAs in these PECAN-aligned windows score so poorly under the gene prediction model - for example, due to inaccuracies in the PECAN alignment of that window - that the predicted ncRNA is consistently placed in the wrong location within the window. These real ncRNAs are, therefore, never detected, no matter how low the scoring threshold, setting an upper limit on the achievable sensitivity.

ROC curves for two non-coding RNA predictors, ClosingBp (Bradley RK, Uzilov AV, Skinner M, Bendaña YR, Barquist L and Holmes I, submitted) and EVOFOLD [39] (implemented using XRATE), comparing DAWG [10] to the richest GSIMULATOR and SIMGENOME models. The three curves for each gene predictor clearly illustrate that increased model richness (DAWG → GSIMULATOR → SIMGENOME) yields higher estimated FPR. See the caption to Figure 1 for an explanation of why the asymptotic sensitivity is less than 1.0.
Similar articles
-
DNA assembly with gaps (Dawg): simulating sequence evolution.Bioinformatics. 2005 Nov 1;21 Suppl 3:iii31-8. doi: 10.1093/bioinformatics/bti1200. Bioinformatics. 2005. PMID: 16306390
-
Genomic features in the breakpoint regions between syntenic blocks.Bioinformatics. 2004 Aug 4;20 Suppl 1:i318-25. doi: 10.1093/bioinformatics/bth934. Bioinformatics. 2004. PMID: 15262815
-
GPAC-genome presence/absence compiler: a web application to comparatively visualize multiple genome-level changes.Mol Biol Evol. 2015 Jan;32(1):275-86. doi: 10.1093/molbev/msu276. Epub 2014 Sep 25. Mol Biol Evol. 2015. PMID: 25261406
-
Current bioinformatics tools in genomic biomedical research (Review).Int J Mol Med. 2006 Jun;17(6):967-73. Int J Mol Med. 2006. PMID: 16685403 Review.
-
Evolution at the nucleotide level: the problem of multiple whole-genome alignment.Hum Mol Genet. 2006 Apr 15;15 Spec No 1:R51-6. doi: 10.1093/hmg/ddl056. Hum Mol Genet. 2006. PMID: 16651369 Review.
Cited by
-
PhyloSim - Monte Carlo simulation of sequence evolution in the R statistical computing environment.BMC Bioinformatics. 2011 Apr 19;12:104. doi: 10.1186/1471-2105-12-104. BMC Bioinformatics. 2011. PMID: 21504561 Free PMC article.
-
Estimating empirical codon hidden Markov models.Mol Biol Evol. 2013 Mar;30(3):725-36. doi: 10.1093/molbev/mss266. Epub 2012 Nov 27. Mol Biol Evol. 2013. PMID: 23188590 Free PMC article.
-
Simulation of genome-wide evolution under heterogeneous substitution models and complex multispecies coalescent histories.Mol Biol Evol. 2014 May;31(5):1295-301. doi: 10.1093/molbev/msu078. Epub 2014 Feb 19. Mol Biol Evol. 2014. PMID: 24557445 Free PMC article.
-
Developing and applying heterogeneous phylogenetic models with XRate.PLoS One. 2012;7(6):e36898. doi: 10.1371/journal.pone.0036898. Epub 2012 Jun 5. PLoS One. 2012. PMID: 22693624 Free PMC article.
-
Simulation of genes and genomes forward in time.Curr Genomics. 2010 Mar;11(1):58-61. doi: 10.2174/138920210790218007. Curr Genomics. 2010. PMID: 20808525 Free PMC article.
References
-
- Pedersen JS, Hein J. Gene finding with a hidden Markov model of genome structure and evolution. Bioinformatics. 2003;19:219–227. - PubMed
-
- Bais AS, Grossmann S, Vingron M. Incorporating evolution of transcription factor binding sites into annotated alignments. J Biosci. 2007;32:841–850. - PubMed
-
- Evans J, Sheneman L, Foster J. Relaxed neighbor joining: a fast distance-based phylogenetic tree construction method. J Mol Evol. 2006;62:785–792. - PubMed
Publication types
MeSH terms
Substances
Grants and funding
LinkOut - more resources
Full Text Sources
