. 2009 May;137(5):654-61.
doi: 10.1017/S0950268808001416. Epub 2008 Oct 8.

Household structure and infectious disease transmission

Affiliations

Household structure and infectious disease transmission

T House et al. Epidemiol Infect. 2009 May.

Abstract

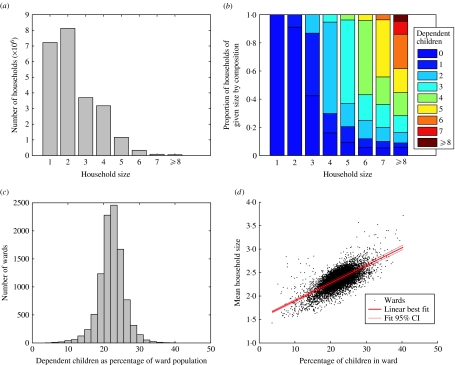
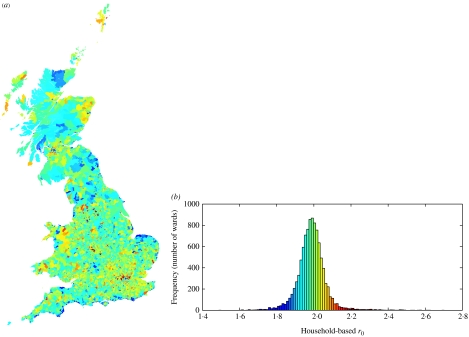
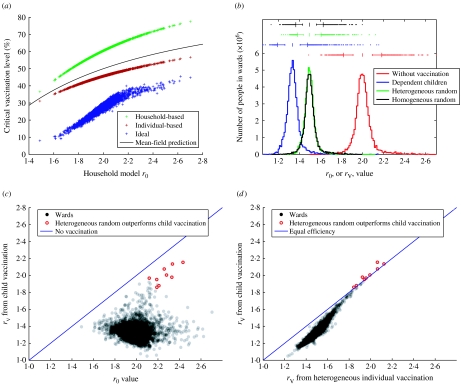
One of the central tenets of modern infectious disease epidemiology is that an understanding of heterogeneities, both in host demography and transmission, allows control to be efficiently optimized. Due to the strong interactions present, households are one of the most important heterogeneities to consider, both in terms of predicting epidemic severity and as a target for intervention. We consider these effects in the context of pandemic influenza in Great Britain, and find that there is significant local (ward-level) variation in the basic reproductive ratio, with some regions predicted to suffer 50% faster growth rate of infection than the mean. Childhood vaccination was shown to be highly effective at controlling an epidemic, generally outperforming random vaccination and substantially reducing the variation between regions; only nine out of over 10 000 wards did not obey this rule and these can be identified as demographically atypical regions. Since these benefits of childhood vaccination are a product of correlations between household size and number of dependent children in the household, our results are qualitatively robust for a variety of disease scenarios.


Figures

Fig. 1
Fig. 1
GB demographics. (a) The distribution of household sizes plotted as the total number of households of each size in Great Britain. (b) The proportions of households with a given number of dependent children separated into household sizes. (c) The distribution of dependent children as percentages of the ward population size. (d) The correlation between percentage of dependent children and the mean household size within a ward; dots represent the values for each of the 9976 standard table wards in Great Britain; a simple linear fit and associated confidence intervals are shown in red. (Data source: 2001 Census Commissioned Table [27]. Crown copyright 2003. Crown copyright material is reproduced with the permission of the Controller of HMSO.)
Fig. 2
Fig. 2
Distribution of r0 values in Great Britain, highlighting the predicted variation in early epidemic growth rates. (a) Wards are shown in their geographic locations and coloured according to their r0 value. The histograms in (b) utilize the same colour scale and hence provide a reference for the ward-based map. (Electronic information on ward boundaries is census output, which is Crown copyright and is reproduced with the permission of the Controller of HMSO and the Queen's Printer for Scotland. Source: 2001 Census, Output Area Boundaries [28, 29]. Crown copyright 2003.)
Fig. 3
Fig. 3
Effects of vaccination. (a) Critical levels of vaccine coverage needed to prevent the spread of infection within a ward are shown for three strategies, along with the prediction from standard models in which there is no population structure. (b) The effects on the distribution of ward rV values of three vaccination strategies. These distributions are calculated at individual level since ward-level results are slightly biased by the trend for less populated wards to have smaller household sizes. The box-whisker plots show the mean, 1 and 2 standard deviations and outliers. (c) The ward-level effects of vaccinating dependent children. (d) Comparison of the ward-level effects of vaccinating dependent children and heterogeneous random vaccination, in which the same proportion of each ward is vaccinated. The nine exceptional wards in which heterogeneous random vaccination outperforms vaccinating dependent children are highlighted (red circles) in plots (c) and (d).

References

    1. Cauchemez S. et al.A Bayesian MCMC approach to study transmission of influenza: application to household longitudinal data. Statistics in Medicine. 2004;23:3469–3487. - PubMed
    1. Longini IM. et al.Estimating household and community transmission parameters for influenza. American Journal of Epidemiology. 1982;115:736–751. - PubMed
    1. Hope-Simpson RE. Infectiousness of communicable diseases in the household. Lancet. 1952;2:549–554. - PubMed
    1. Wu JT. et al.Reducing the impact of the next influenza pandemic using household-based public health interventions. PLoS Medicine. 2006;3:1532–1540. - PMC - PubMed
    1. Dodd PJ, Ferguson NM. Approximate disease dynamics in household-structured populations. Journal of the Royal Society Interface. 2007;4:1103–1106. - PMC - PubMed

Publication types

MeSH terms