. 2008 Oct;8(4):301-9.
doi: 10.1016/j.cmet.2008.08.015.

Ablation of CD11c-positive cells normalizes insulin sensitivity in obese insulin resistant animals

Affiliations

Ablation of CD11c-positive cells normalizes insulin sensitivity in obese insulin resistant animals

David Patsouris et al. Cell Metab. 2008 Oct.

Abstract

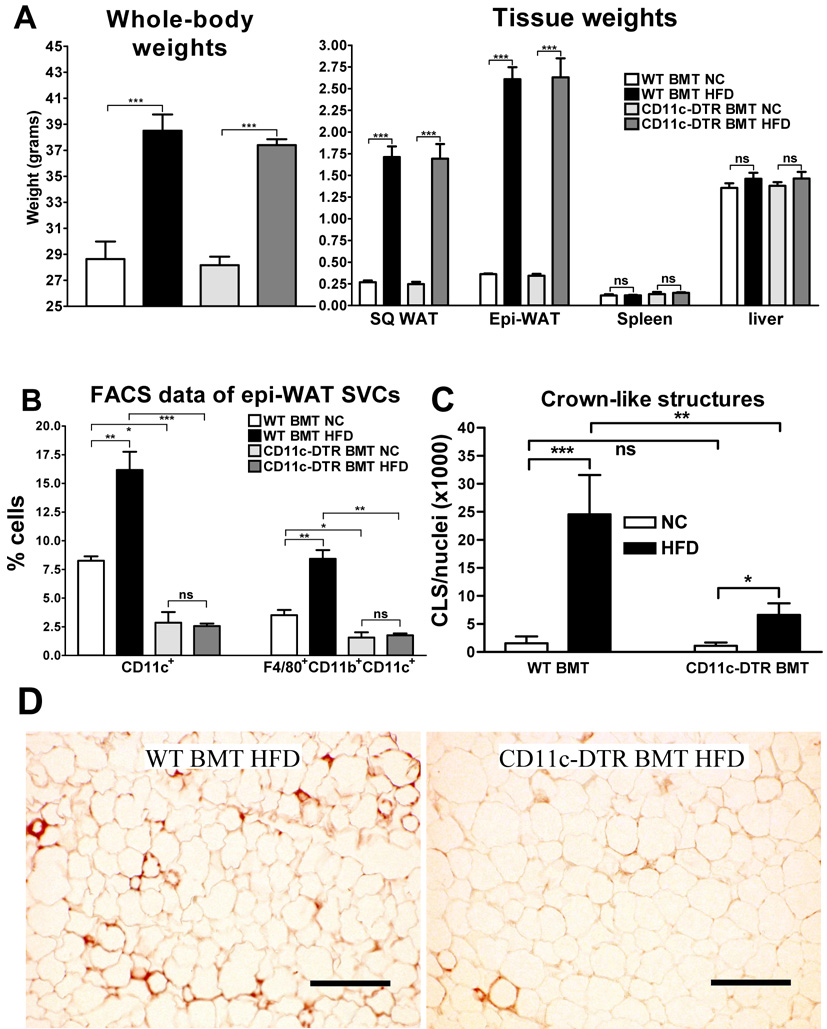
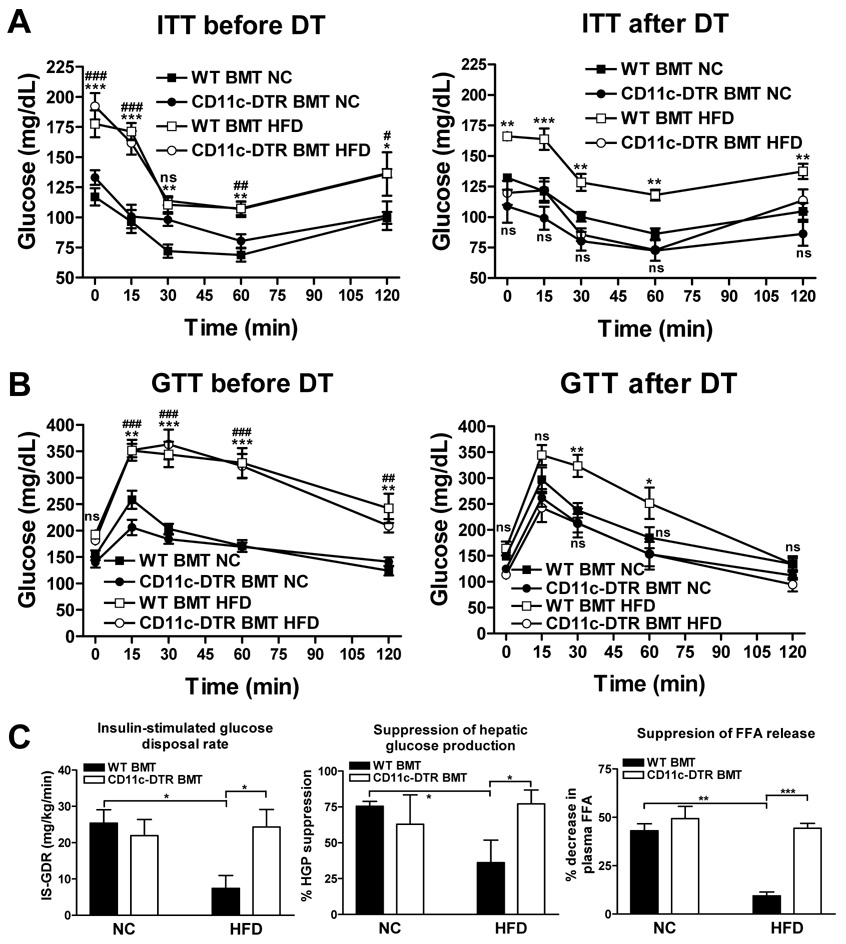
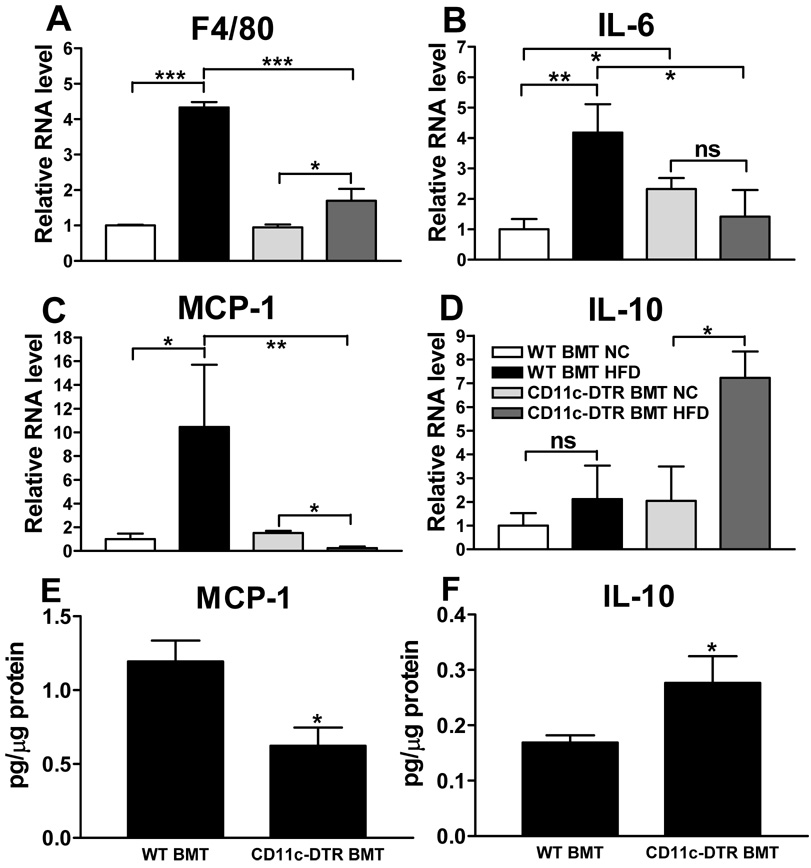
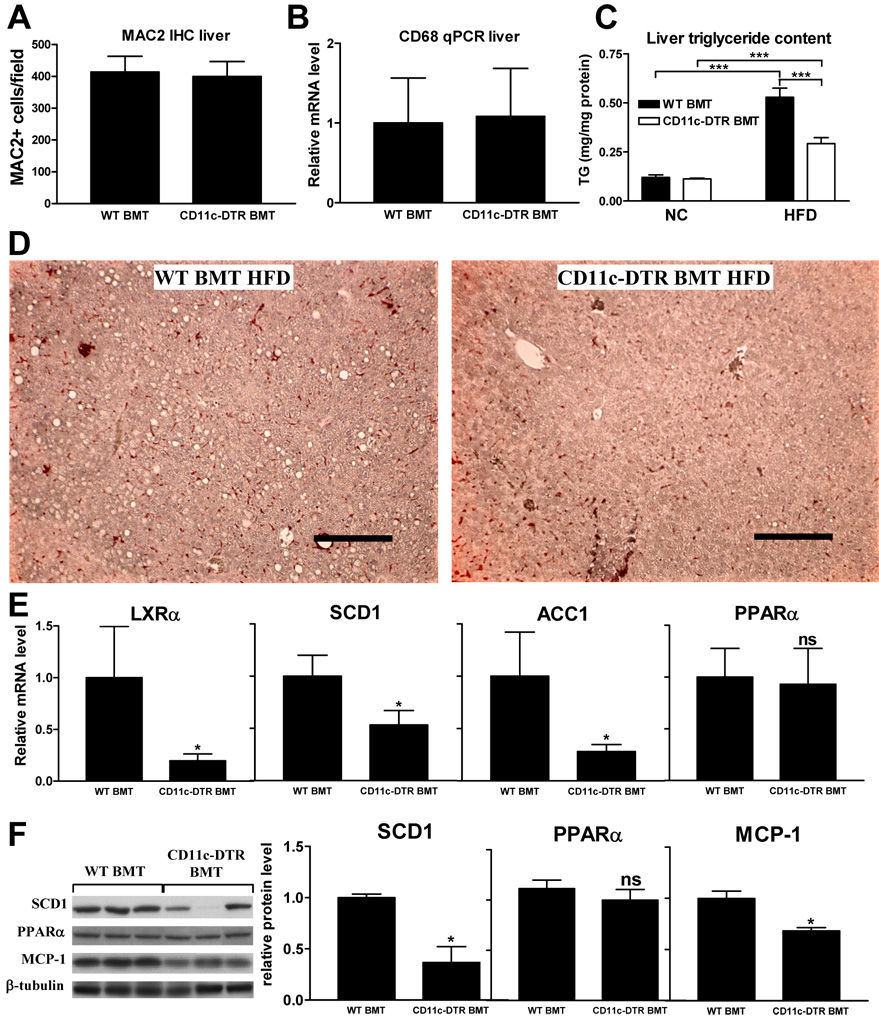
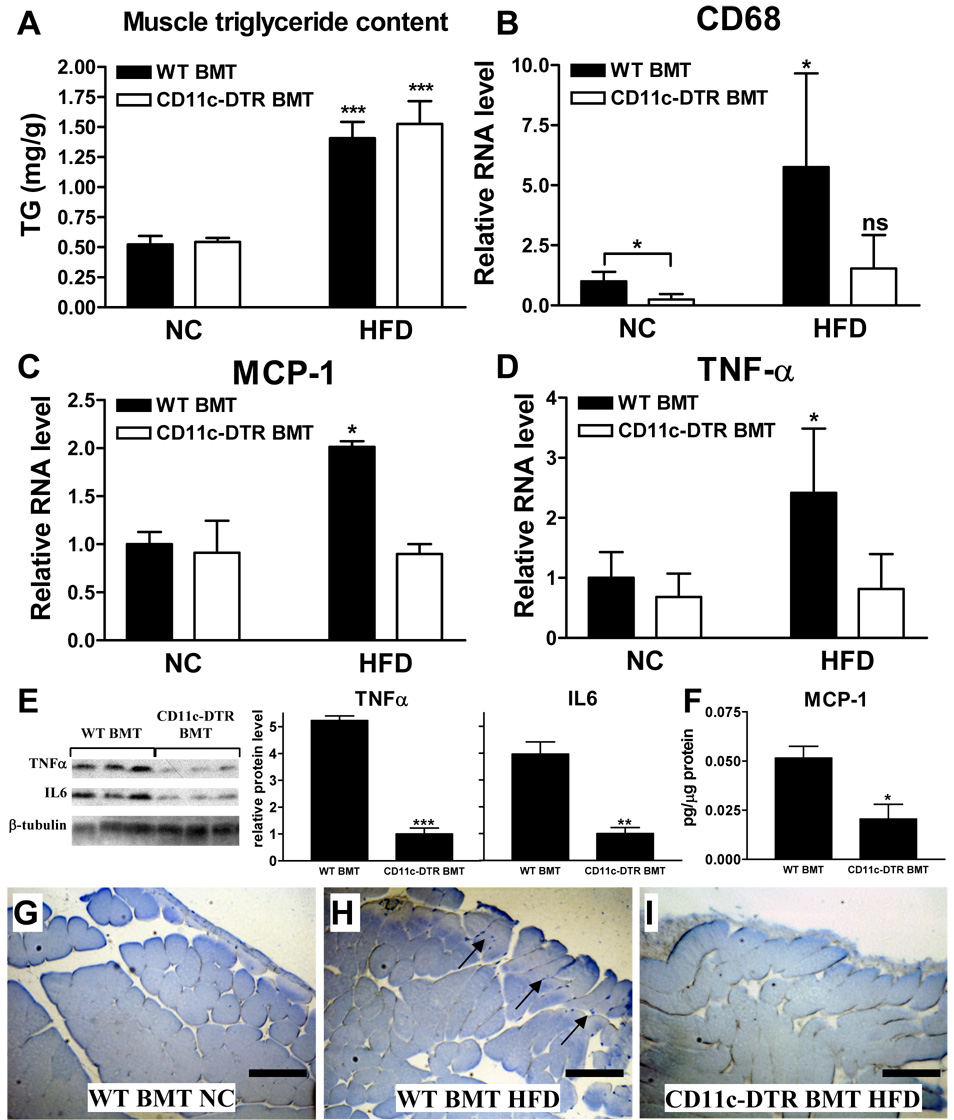
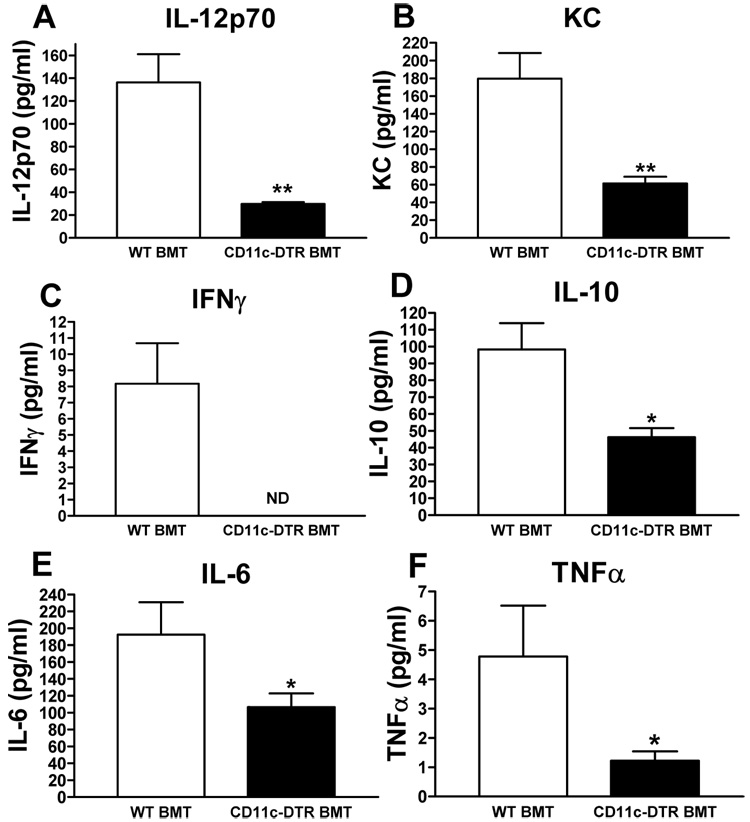
Obese adipose tissue is characterized by infiltration of macrophages. We and others recently showed that a specific subset of macrophages is recruited to obese adipose and muscle tissue. This subset expresses CD11c and produces high levels of proinflammatory cytokines that are linked to the development of obesity-associated insulin resistance. Here, we used a conditional cell ablation system, based on transgenic expression of the diphtheria toxin receptor under the control of the CD11c promoter, to study the effects of depletion of CD11c+ cells in obese mouse models. Our results show that CD11c+ cell depletion results in rapid normalization of insulin sensitivity. Furthermore, CD11c+ cell ablation leads to a marked decrease in inflammatory markers, both locally and systemically, as reflected by gene expression and protein levels. Together, these results indicate that these CD11c+ cells are a potential therapeutic target for treatment of obesity-related insulin resistance and type II diabetes.


Figures

Figure 1
Figure 1. Ablation of CD11c+ cells leads to a reduction of crown-like structures in epi-WAT
a) Whole-body (left) and tissue weights (right) in grams of both WT BMT and CD11c-DTR BMT mice fed NC or HFD. Whole-body weights were measured before DT treatment and tissue weights were measured after DT treatment at time of sacrifice. b) SVFs were extracted from the epi-WAT samples. The SVCs were subsequently stained for F4/80, CD11b, and CD11c cell surface proteins and analyzed by FACS. The number of CD11c+ and F4/80+CD11b+CD11c+ cells is indicated as percentage of total SVCs. c) Paraffin-imbedded epi-WAT sections were stained for MAC-2. Stained slides were subsequently coverslipped with DAPI-containing mounting media and brightfield (MAC-2) and fluorescent (DAPI) images were taken of 3 representative fields per slide in a blinded fashion using a fluorescent microscope (10 × objective). Nuclei per field were quantified by counting DAPI-positive nuclei using ImageJ software. MAC-2 positive crown-like structures (CLS) per field were counted manually and the number of CLS per 1000 nuclei was used as another measure of adipose tissue macrophage content. d) Examples of MAC2 immunohistochemistry as quantified in panel c. MAC2-stained cells (brown) surrounding adipocytes form the CLS. Scale bar represents 250 µm. All data shown in this figure were combined from 4 groups of mice that were treated with DT for a period of 3, 5, 9, or 17 days. Data are expressed as mean ± SEM. *P<0.05; **P<0.01; *** P<0.001; ns means not significant; n ≥ 15 per group.
Figure 2
Figure 2. Metabolic studies
In vivo glucose homeostasis as determined by ITTs (a) or GTTs (b) before (left) and 24-hrs after (right) a single dose of DT treatment. Data are expressed as mean ± SEM, n = 5 per group. *P<0.05. **P<0.01, *** P<0.001, and ns means not significant when comparing WT BMT HFD versus WT BMT NC. #P<0.05. ##P<0.01, ### P<0.001, and ns means not significant when comparing CD11c-DTR BMT HFD versus CD11c-DTR BMT NC. c) In vivo insulin sensitivity as determined by euglycemic clamp studies in NC- and HFD-fed WT and CD11c-DTR BMT mice treated with DT. IS-GDR (left) is indicative of insulin sensitivity in skeletal muscle, liver insulin sensitivity is reflected by suppression of hepatic glucose production (middle), and suppression of plasma free fatty acids is a measure for adipose insulin sensitivity (right). NC data was from mice treated with DT for 14 days. HFD data was combined from 3 sets of mice that received DT for 1, 3, or 7 days. Data are expressed as mean ± SEM. *P<0.05, **P<0.01 and *** P<0.001. n=5 per group for NC data and n ≥ 15 per group for HFD data.
Figure 3
Figure 3. WAT mRNA and protein levels
Gene expression in adipose tissue from mice treated with DT for 9 days was analyzed by measuring relative mRNA levels using qPCR for a) the macrophage marker F4/80, b) the pro-inflammatory cytokine IL-6, c) the pro-inflammatory chemokine and macrophage chemoattractant MCP-1, and d) the anti-inflammatory cytokine IL-10. The protein levels of e) MCP-1 and f) IL-10 were measured in adipose tissues lysates of HFD-fed WT and CD11c-DTR BMT mice. Data are expressed as mean ± SEM. *P<0.05; **P<0.01; ***P<0.001; ns means not significant. n ≥ 4 per group.
Figure 4
Figure 4. Liver data
Liver macrophage content as measured by quantification of a) MAC2 immunohistochemistry and b) relative mRNA levels of the macrophage marker CD68. c) Liver triglyceride content as measured in liver lysates and d) as illustrated by presence of clear lipid droplets in MAC2-stained liver tissue sections. Scale bar represents 250 µm. e) Relative liver mRNA levels of liver X receptor alpha (LXRα), stearoyl CoA desaturase-1 (SCD1), acetyl-CoA carboxylase 1 (ACC1), and peroxisome proliferator-activated receptor (PPAR) α. f) Western blots for SCD1, PPARα, MCP-1 and β-tubulin showing relative protein levels normalized to β-tubulin. All data shown in this figure were combined from 4 groups of mice that were treated with DT for a period of 3, 5, 9, or 17 days. Data are expressed as mean ± SEM. *P<0.05 compared to WT BMT. ***P<0.001. n ≥ 15 per group. ns means not significant.
Figure 5
Figure 5. Muscle data
a) Triglyceride levels in quadriceps muscles. b) Muscle macrophage content as quantified by determining the relative mRNA level of the macrophage marker CD68 by qPCR. Relative mRNA levels of the inflammatory factors c) MCP-1 and d) TNF-α in quadriceps muscles as determined by qPCR. Protein levels of e) TNFα and IL6 measured by Western blot and f) MCP-1 measured by multiplex ELISA in skeletal muscle tissue lysates of HFD-fed WT and CD11c-DTR BMT mice. Western blot data were expressed as relative protein level normalized to β-tubulin. MAC2-stained muscle section of a g) NC-fed WT BMT mouse, h) a HFD-fed WT BMT mouse, and i) a HFD-fed CD11c-DTR mouse. The arrows in panel h point towards tissue areas where MAC2-positive macrophages are visible (blue staining). Scale bar represents 250 µm. The quadriceps muscles were obtained from a group of mice that was treated with DT for a period of 9 days and the data are expressed as mean ± SEM. *P<0.05, ** P<0.01, ***P<0.001, and ns means not significant when compared to NC-fed or WT counterpart. n=5 per group.
Figure 6
Figure 6. Serum cytokine/chemokine measurements
Multiplex ELISA was used to measure the concentration of a) IL-12p70, b) keratinocyte-derived chemokine (KC), c) interferon γ (IFNγ), d) IL-10, e) IL-6, and f) TNF-α in serum of HFD-fed, DT treated CD11c-DTR BMT mice and their WT counterparts. Data are expressed as mean ± SEM and was combined from 4 groups of mice that were treated with DT for a period of 3, 5, 9, or 17 days. *P<0.05; **P<0.01; ND means not detectable. n = 12 per group.

Similar articles

Cited by

References

    1. Arkan MC, Hevener AL, Greten FR, Maeda S, Li ZW, Long JM, Wynshaw-Boris A, Poli G, Olefsky J, Karin M. IKK-beta links inflammation to obesity-induced insulin resistance. Nat Med. 2005;11:191–198. - PubMed
    1. Brake DK, Smith EO, Mersmann H, Smith CW, Robker RL. ICAM-1 expression in adipose tissue: effects of diet-induced obesity in mice. Am J Physiol Cell Physiol. 2006;291:C1232–C1239. - PubMed
    1. Cancello R, Henegar C, Viguerie N, Taleb S, Poitou C, Rouault C, Coupaye M, Pelloux V, Hugol D, Bouillot JL, et al. Reduction of macrophage infiltration and chemoattractant gene expression changes in white adipose tissue of morbidly obese subjects after surgery-induced weight loss. Diabetes. 2005;54:2277–2286. - PubMed
    1. Cinti S, Mitchell G, Barbatelli G, Murano I, Ceresi E, Faloia E, Wang S, Fortier M, Greenberg AS, Obin MS. Adipocyte death defines macrophage localization and function in adipose tissue of obese mice and humans. J Lipid Res. 2005;46:2347–2355. - PubMed
    1. Ellacott KL, Murphy JG, Marks DL, Cone RD. Obesity-induced inflammation in white adipose tissue is attenuated by loss of melanocortin-3 receptor signaling. Endocrinology. 2007;148:6186–6194. - PubMed

Publication types

MeSH terms