

Structural insight into the kinetics and DeltaCp of interactions between TEM-1 beta-lactamase and beta-lactamase inhibitory protein (BLIP)
- PMID: 18840610
- PMCID: PMC2610523
- DOI: 10.1074/jbc.M804089200
Structural insight into the kinetics and DeltaCp of interactions between TEM-1 beta-lactamase and beta-lactamase inhibitory protein (BLIP)
Abstract
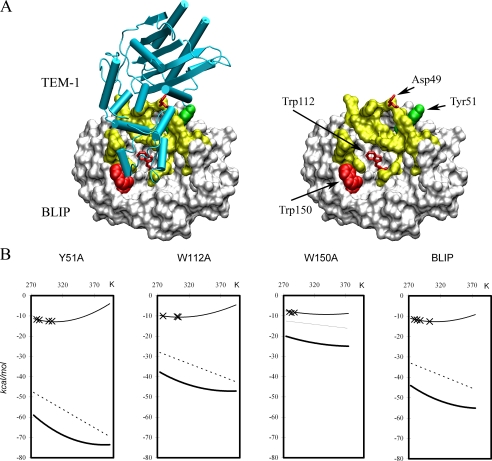
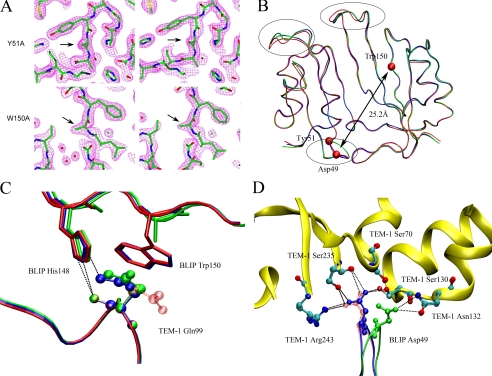
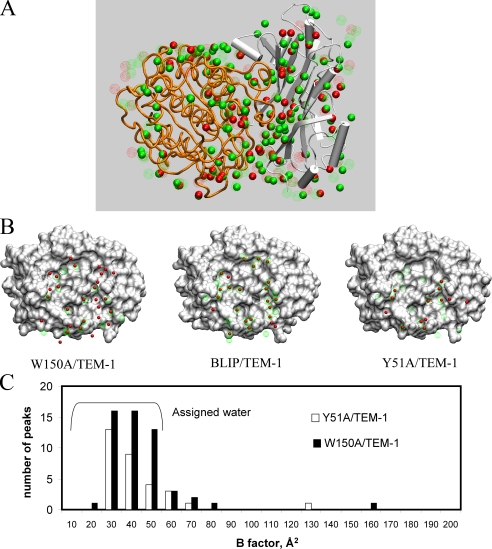
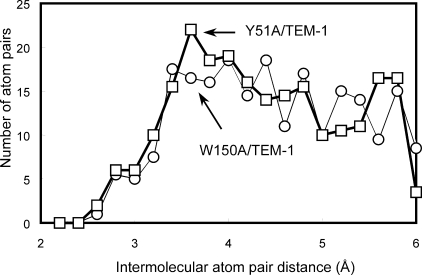
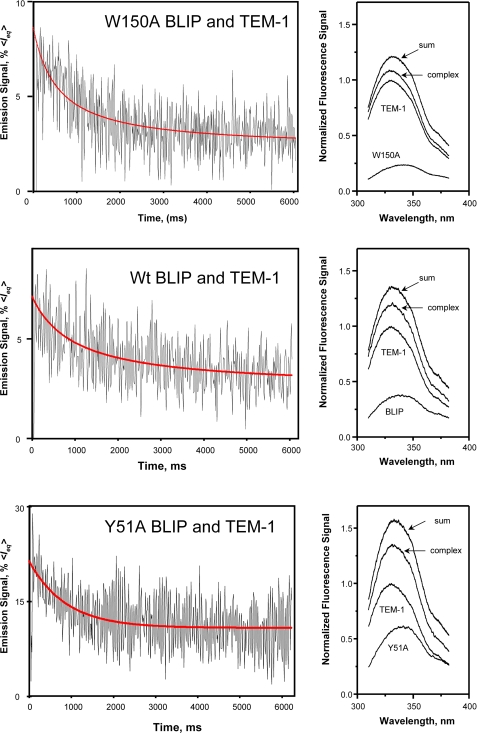
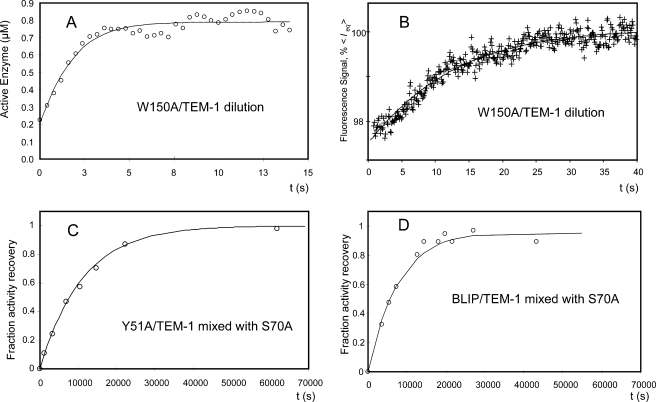
In a previous study, we examined thermodynamic parameters for 20 alanine mutants in beta-lactamase inhibitory protein (BLIP) for binding to TEM-1 beta-lactamase. Here we have determined the structures of two thermodynamically distinctive complexes of BLIP mutants with TEM-1 beta-lactamase. The complex BLIP Y51A-TEM-1 is a tight binding complex with the most negative binding heat capacity change (DeltaG = approximately -13 kcal mol(-1) and DeltaCp = approximately -0.8 kcal mol(-1) K(-1)) among all of the mutants, whereas BLIP W150A-TEM-1 is a weak complex with one of the least negative binding heat capacity changes (DeltaG = approximately -8.5 kcal mol(-1) and DeltaCp = approximately -0.27 kcal mol(-1) K(-1)). We previously determined that BLIP Tyr51 is a canonical and Trp150 an anti-canonical TEM-1-contact residue, where canonical refers to the alanine substitution resulting in a matched change in the hydrophobicity of binding free energy. Structure determination indicates a rearrangement of the interactions between Asp49 of the W150A BLIP mutant and the catalytic pocket of TEM-1. The Asp49 of W150A moves more than 4 angstroms to form two new hydrogen bonds while losing four original hydrogen bonds. This explains the anti-canonical nature of the Trp150 to alanine substitution, and also reveals a strong long distance coupling between Trp150 and Asp49 of BLIP, because these two residues are more than 25 angstroms apart. Kinetic measurements indicate that the mutations influence the dissociation rate but not the association rate. Further analysis of the structures indicates that an increased number of interface-trapped water molecules correlate with poor interface packing in a mutant. It appears that the increase of interface-trapped water molecules is inversely correlated with negative binding heat capacity changes.
Figures
Similar articles
-
Thermodynamic investigation of the role of contact residues of beta-lactamase-inhibitory protein for binding to TEM-1 beta-lactamase.J Biol Chem. 2007 Jun 15;282(24):17676-84. doi: 10.1074/jbc.M611548200. Epub 2007 Apr 12. J Biol Chem. 2007. PMID: 17430899
-
Computational redesign of the SHV-1 beta-lactamase/beta-lactamase inhibitor protein interface.J Mol Biol. 2008 Oct 24;382(5):1265-75. doi: 10.1016/j.jmb.2008.05.051. Epub 2008 May 29. J Mol Biol. 2008. PMID: 18775544 Free PMC article.
-
Contributions of aspartate 49 and phenylalanine 142 residues of a tight binding inhibitory protein of beta-lactamases.J Biol Chem. 1999 Jan 22;274(4):2394-400. doi: 10.1074/jbc.274.4.2394. J Biol Chem. 1999. PMID: 9891008
-
Structural and computational characterization of the SHV-1 beta-lactamase-beta-lactamase inhibitor protein interface.J Biol Chem. 2006 Sep 8;281(36):26745-53. doi: 10.1074/jbc.M603878200. Epub 2006 Jun 29. J Biol Chem. 2006. PMID: 16809340
-
Insight into Structure-Function Relationships of β-Lactamase and BLIPs Interface Plasticity using Protein-Protein Interactions.Curr Pharm Des. 2019;25(31):3378-3389. doi: 10.2174/1381612825666190911154650. Curr Pharm Des. 2019. PMID: 31544712 Review.
Cited by
-
Role of β-lactamase residues in a common interface for binding the structurally unrelated inhibitory proteins BLIP and BLIP-II.Protein Sci. 2014 Sep;23(9):1235-46. doi: 10.1002/pro.2505. Epub 2014 Jul 1. Protein Sci. 2014. PMID: 24947275 Free PMC article.
-
Structural comparison of substrate-binding pockets of serine β-lactamases in classes A, C, and D.J Enzyme Inhib Med Chem. 2025 Dec;40(1):2435365. doi: 10.1080/14756366.2024.2435365. Epub 2024 Dec 23. J Enzyme Inhib Med Chem. 2025. PMID: 39714271 Free PMC article. Review.
-
Tackling the Antibiotic Resistance Caused by Class A β-Lactamases through the Use of β-Lactamase Inhibitory Protein.Int J Mol Sci. 2018 Jul 30;19(8):2222. doi: 10.3390/ijms19082222. Int J Mol Sci. 2018. PMID: 30061509 Free PMC article.
-
Structural and biochemical characterization of the interaction between KPC-2 beta-lactamase and beta-lactamase inhibitor protein.Biochemistry. 2009 Oct 6;48(39):9185-93. doi: 10.1021/bi9007963. Biochemistry. 2009. PMID: 19731932 Free PMC article.
-
Systematic substitutions at BLIP position 50 result in changes in binding specificity for class A β-lactamases.BMC Biochem. 2017 Mar 6;18(1):2. doi: 10.1186/s12858-017-0077-1. BMC Biochem. 2017. PMID: 28264645 Free PMC article.
References
Publication types
MeSH terms
Substances
Associated data
- Actions
- Actions
Grants and funding
LinkOut - more resources
Full Text Sources
Miscellaneous
