. 2008 Oct 14;105(41):15779-84.
doi: 10.1073/pnas.0808480105. Epub 2008 Oct 7.

Exploring RNA transcription and turnover in vivo by using click chemistry

Affiliations

Exploring RNA transcription and turnover in vivo by using click chemistry

Cindy Y Jao et al. Proc Natl Acad Sci U S A. .

Abstract

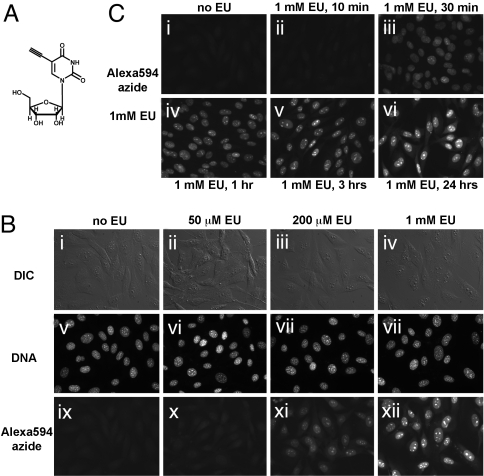
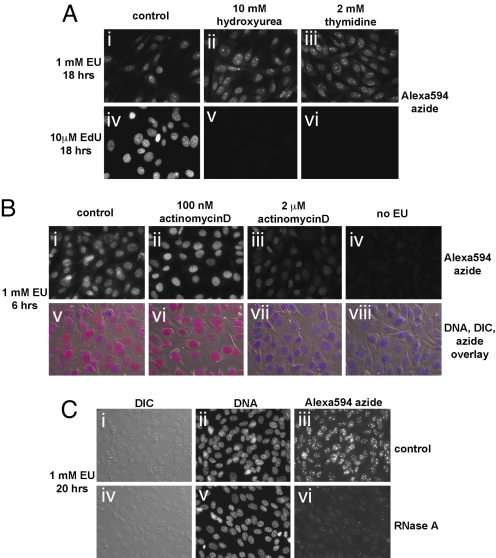
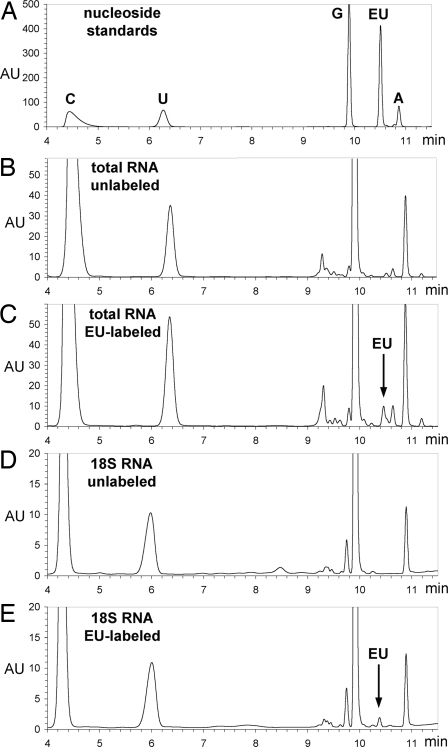
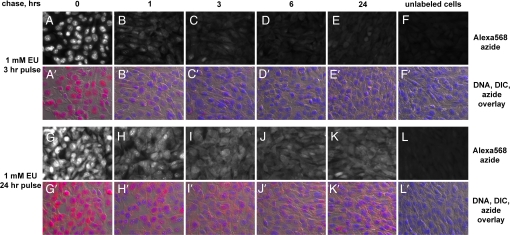
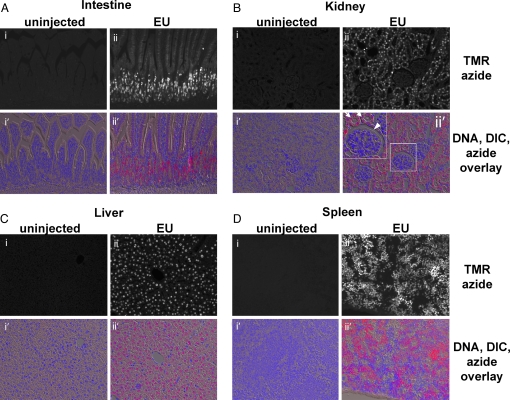
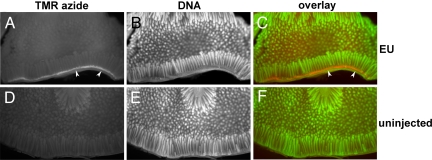
We describe a chemical method to detect RNA synthesis in cells, based on the biosynthetic incorporation of the uridine analog 5-ethynyluridine (EU) into newly transcribed RNA, on average once every 35 uridine residues in total RNA. EU-labeled cellular RNA is detected quickly and with high sensitivity by using a copper (I)-catalyzed cycloaddition reaction (often referred to as "click" chemistry) with fluorescent azides, followed by microscopic imaging. We demonstrate the use of this method in cultured cells, in which we examine the turnover of bulk RNA after EU pulses of varying lengths. We also use EU to assay transcription rates of various tissues in whole animals, both on sections and by whole-mount staining. We find that total transcription rates vary greatly among different tissues and among different cell types within organs.


Conflict of interest statement

The authors declare no conflict of interest.

Figures

Fig. 1.
Fig. 1.
Imaging cellular transcription by using EU. (A) Structure of the uridine analog EU, a biosynthetic RNA label. (B) EU incorporation into RNA in NIH 3T3 cells. Cells were grown without EU (i, v, and ix), with 50 μM EU (ii, vi, and x), 200 μM EU (iii, vii, and xi), or 1 mM EU (iv, viii, and xii) for 20 h. The cells were fixed and reacted with 10 μM Alexa594-azide. EU-labeled cells show strong nuclear and weaker cytoplasmic staining, proportional to the added EU concentration. Note the intense staining of nucleoli. All cells incorporate EU, although some cell-to-cell variability is observed. (C) Rapid uptake and incorporation of EU by cells. NIH 3T3 cells were incubated with 1 mM EU for varying amounts of time, followed by fixation and EU detection. Strong nuclear staining is visible after 30 min (iii), although even after 10 min (ii), a signal above background is observed at longer exposure times (data not shown). EU staining intensity increases quickly in the first 3 h (iv and v) and then more slowly up to 24 h (vi).
Fig. 2.
Fig. 2.
EU is incorporated into cellular RNA but not DNA. (A) Inhibition of DNA synthesis by hydroxyurea or thymidine does not affect EU incorporation in cells. NIH 3T3 cells incubated with 1 mM EU and 10 mM hydroxyurea (ii) or 2 mM thymidine (iii) show EU staining identical to cells incubated with 1 mM EU alone (i). The same concentrations of hydroxyurea or thymidine strongly inhibit incorporation of EdU (at 10 μM) into DNA (v and vi). (B) Actinomycin D inhibits EU incorporation in cells. At low concentration (100 nM, sufficient to inhibit RNA polymerase I; ii and vi), actinomycin D abolishes the strong EU staining of nucleoli seen after incubation for 6 h in 1 mM EU (compare with i and v). Note that except for the absence of nucleolar staining, cells show normal levels of nuclear EU staining. A high concentration of actinomycin D (2 μM, sufficient to block RNA polymerase II; iii and vii) causes a pronounced inhibition of EU incorporation in cells. (C) EU staining is sensitive to RNaseA. Cells labeled with 1 mM EU for 6 h were permeabilized and lightly fixed followed by treatment with (iv–vi) or without (i–iii) RNaseA. The cells were subsequently stained with 10 μM Alexa594-azide and Hoechst.
Fig. 3.
Fig. 3.
Analysis of EU incorporation into RNA. (A) HPLC separation of an equimolar mixture of pure cytidine, uridine, guanosine, EU, and adenosine. Absorbtion at 285 nm (in arbitrary units, AU) is plotted against elution time (in minutes). (B and C) HPLC analysis of nucleosides from total RNA isolated from unlabeled (B) and EU-labeled (C) cells. Note the EU peak in C, corresponding to a 2.8% substitution of uridine residues by EU. (D and E) HPLC analysis of nucleosides from unlabeled and EU-labeled, gel-purified 18S ribosomal RNA. The EU peak in E corresponds to a 1.3% substitution of uridine with EU. An identical degree of substitution was measured for the 28S ribosomal RNA (data not shown), consistent with the fact that 18S and 28S rRNAs are both derived from the pre-rRNA 45S precursor transcribed by RNA polymerase I.
Fig. 4.
Fig. 4.
Imaging cellular RNA turnover with EU. NIH 3T3 cells were labeled for 3 h (A–F and A′–F′) or 24 h (G–L and G′–L′) with 1 mM EU. The label was chased with complete media for different periods of time. The cells were fixed and stained with Alexa568-azide and Hoechst. After a 3-h pulse the nuclear EU staining drops quickly in the first hour of the chase (A and B; A′ and B′) and becomes very low after 6 h (D and D′). EU staining of the cytoplasm shows a delayed decline compared with the nuclear signal. Cytoplasmic staining is still visible after 6 h (D and D′), whereas after 24 h (E and E′) it drops very close to background levels (F and F′). After labeling with EU for 24 h, both the nucleus and the cytoplasm are strongly labeled (G and G′). The nuclear signal drops significantly during the chase but does not disappear. Strong cytoplasmic staining persists after a 24-hour chase, indicating the labeling of stable RNA species.
Fig. 5.
Fig. 5.
Imaging total RNA synthesis in vivo by using EU. Tissues from a EU-injected mouse (2 mg EU) and an uninjected control littermate were harvested and fixed 5 h later. Tissue sections were stained with 25 μM TMR-azide and Hoechst. The black-and-white images are fluorescent micrographs of mouse tissues stained with TMR-azide. The color images are overlays of fluorescent azide (red), fluorescent DNA (blue), and DIC micrographs of the sectioned tissues. (A) Villi of the small intestine seen in longitudinal section. Actively transcribing cells are located in the crypts and the base of the villi; EU staining is much weaker but clearly visible in the cells along villi. (B) Kidney. Kidney tubules (the two arrows in the Inset of ii′) show strong EU staining; EU-labeled RNA is strikingly absent from glomeruli (the arrowhead in the Inset of ii′). (C) Liver. All hepatocytes show strong EU staining, whereas staining is absent in cells located at the periphery of liver lobules. (D) Spleen. A large subset of the lymphocytes seen in spleen sections show very intense EU staining; however, EU incorporation is absent from some of the cells, indicating dramatically different levels of bulk transcriptional activity.
Fig. 6.
Fig. 6.
Whole-mount staining of RNA synthesis in the mouse small intestine by using EU. Fragments of intestine were removed from an uninjected control mouse and from an EU-injected mouse, 5 h after the i.p. injection of 2 mg of EU. The explants were fixed and then stained with 50 μM TMR-azide and OliGreen (to visualize DNA), and were imaged on a fluorescent dissecting microscope. Note the strong EU incorporation in crypt cells and cells located at the base of the villi (the white band in A or the orange band in C, indicated by white arrowheads).

References

    1. Uddin M, et al. Radioautographic visualization of differences in the pattern of [3H]uridine and [3H]orotic acid incorporation into the RNA of migrating columnar cells in the rat small intestine. J Cell Biol. 1984;98:1619–1629. - PMC - PubMed
    1. Wansink DG, et al. Fluorescent labeling of nascent RNA reveals transcription by RNA polymerase II in domains scattered throughout the nucleus. J Cell Biol. 1993;122:283–293. - PMC - PubMed
    1. Cmarko D, et al. Ultrastructural analysis of transcription and splicing in the cell nucleus after bromo-UTP microinjection. Mol Biol Cell. 1999;10:211–223. - PMC - PubMed
    1. Wei X, et al. Three-dimensional visualization of transcription sites and their association with splicing factor-rich nuclear speckles. J Cell Biol. 1999;146:543–558. - PMC - PubMed
    1. Haukenes G, et al. Labeling of RNA transcripts of eukaryotic cells in culture with BrUTP using a liposome transfection reagent (DOTAP) BioTechniques. 1997;22:308–312. - PubMed

Publication types