

Anisotropic rheology and directional mechanotransduction in vascular endothelial cells
- PMID: 18840694
- PMCID: PMC2563098
- DOI: 10.1073/pnas.0804573105
Anisotropic rheology and directional mechanotransduction in vascular endothelial cells
Abstract
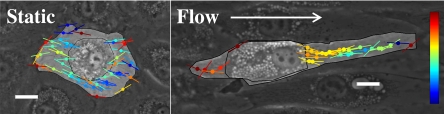
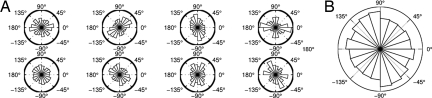
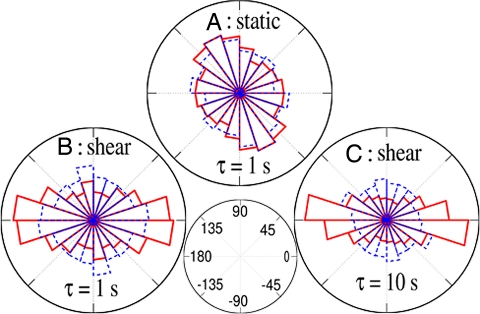
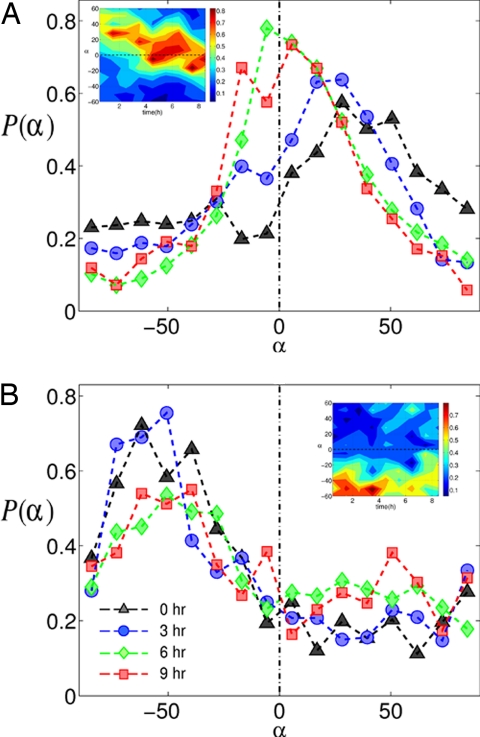
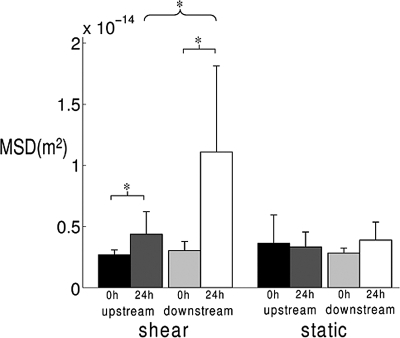
Adherent cells remodel their cytoskeleton, including its directionality, in response to directional mechanical stimuli with consequent redistribution of intracellular forces and modulation of cell function. We analyzed the temporal and spatial changes in magnitude and directionality of the cytoplasmic creep compliance (Gamma) in confluent cultures of bovine aortic endothelial cells subjected to continuous laminar flow shear stresses. We extended particle tracking microrheology to determine at each point in the cytoplasm the principal directions along which Gamma is maximal and minimal. Under static condition, the cells have polygonal shapes without specific alignment. Although Gamma of each cell exhibits directionality with varying principal directions, Gamma averaged over the whole cell population is isotropic. After continuous laminar flow shear stresses, all cells gradually elongate and the directions of maximal and minimal Gamma become, respectively, parallel and perpendicular to flow direction. This mechanical alignment is accompanied by a transition of the cytoplasm to be more fluid-like along the flow direction and more solid-like along the perpendicular direction; at the same time Gamma increases at the downstream part of the cells. The resulting directional anisotropy and spatial inhomogeneity of cytoplasmic rheology may play an important role in mechanotransduction in adherent cells by providing a means to sense the direction of mechanical stimuli.
Conflict of interest statement
The authors declare no conflict of interest.
Figures
Similar articles
-
Role of cell surface heparan sulfate proteoglycans in endothelial cell migration and mechanotransduction.J Cell Physiol. 2005 Apr;203(1):166-76. doi: 10.1002/jcp.20220. J Cell Physiol. 2005. PMID: 15389626
-
Unique morphology and focal adhesion development of valvular endothelial cells in static and fluid flow environments.Arterioscler Thromb Vasc Biol. 2004 Aug;24(8):1429-34. doi: 10.1161/01.ATV.0000130462.50769.5a. Epub 2004 Apr 29. Arterioscler Thromb Vasc Biol. 2004. PMID: 15117733
-
Endothelial mechanotransduction, nitric oxide and vascular inflammation.J Intern Med. 2006 Apr;259(4):351-63. doi: 10.1111/j.1365-2796.2006.01621.x. J Intern Med. 2006. PMID: 16594903 Review.
-
Macrorheology and adaptive microrheology of endothelial cells subjected to fluid shear stress.Am J Physiol Cell Physiol. 2007 Nov;293(5):C1568-75. doi: 10.1152/ajpcell.00193.2007. Epub 2007 Aug 1. Am J Physiol Cell Physiol. 2007. PMID: 17670893 Free PMC article.
-
Mechanosensitive properties in the endothelium and their roles in the regulation of endothelial function.J Cardiovasc Pharmacol. 2013 Jun;61(6):461-70. doi: 10.1097/FJC.0b013e31828c0933. J Cardiovasc Pharmacol. 2013. PMID: 23429585 Review.
Cited by
-
Mechanical plasticity of cells.Nat Mater. 2016 Oct;15(10):1090-4. doi: 10.1038/nmat4689. Epub 2016 Jul 4. Nat Mater. 2016. PMID: 27376682
-
Endothelial mechanobiology.APL Bioeng. 2020 Feb 20;4(1):010904. doi: 10.1063/1.5129563. eCollection 2020 Mar. APL Bioeng. 2020. PMID: 32095737 Free PMC article.
-
Single-Cell Migration in Complex Microenvironments: Mechanics and Signaling Dynamics.J Biomech Eng. 2016 Feb;138(2):021004. doi: 10.1115/1.4032188. J Biomech Eng. 2016. PMID: 26639083 Free PMC article. Review.
-
Angiogenesis in Free-Standing Two-Vasculature-Embedded Scaffold Extruded by Two-Core Laminar Flow Device.Int J Bioprint. 2022 May 13;8(3):557. doi: 10.18063/ijb.v8i3.557. eCollection 2022. Int J Bioprint. 2022. PMID: 36105137 Free PMC article.
-
Early committed polarization of intracellular tension in response to cell shape determines the osteogenic differentiation of mesenchymal stromal cells.Acta Biomater. 2023 Jun;163:287-301. doi: 10.1016/j.actbio.2022.10.052. Epub 2022 Nov 1. Acta Biomater. 2023. PMID: 36328121 Free PMC article.
References
-
- Fung YC, Liu SQ. Elementary mechanics of the endothelium of blood vessels. J Biomech Eng. 1993;115:1–12. - PubMed
-
- Levesque MJ, Nerem RM. The elongation and orientation of cultured endothelial cells in response to shear stress. J Biomech Eng. 1985;107:341–347. - PubMed
-
- Galbraith CG, Skalak R, Chien S. Shear stress induces spatial reorganization of the endothelial cell cytoskeleton. Cell Motility and the Cytoskeleton. 1998;40:317–330. - PubMed
Publication types
MeSH terms
Grants and funding
LinkOut - more resources
Full Text Sources
