

Leaf investment and light partitioning among leaves of different genotypes of the clonal plant Potentilla reptans in a dense stand after 5 years of competition
- PMID: 18840875
- PMCID: PMC2712402
- DOI: 10.1093/aob/mcn185
Leaf investment and light partitioning among leaves of different genotypes of the clonal plant Potentilla reptans in a dense stand after 5 years of competition
Abstract
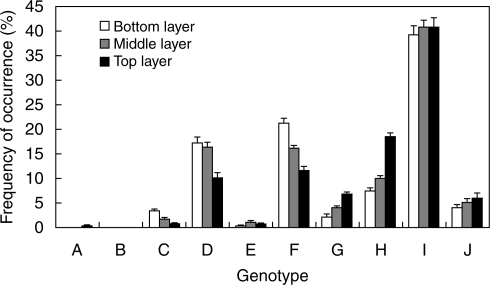
Background and aims: While within-species competition for light is generally found to be asymmetric - larger plants absorbing more than proportional amounts of light - between-species competition tends to be more symmetric. Here, the light capture was analysed in a 5-year-old competition experiment that started with ten genotypes of the clonal plant Potentilla reptans. The following hypotheses were tested: (a) if different genotypes would do better in different layers of the canopy, thereby promoting coexistence, and (b) if leaves and genotypes with higher total mass captured more than proportional amounts of light, possibly explaining the observed dominance of the abundant genotypes.
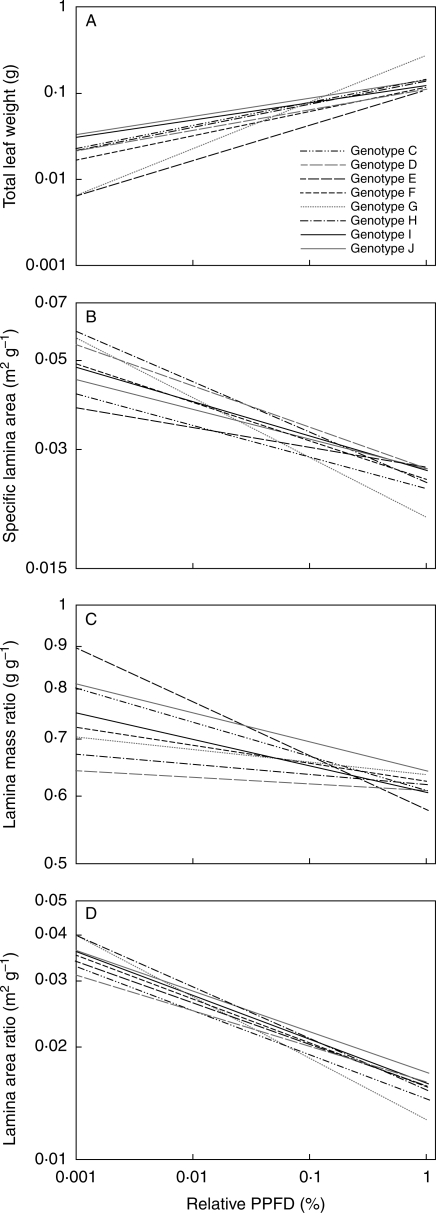
Methods: In eight plots, 100 leaves were harvested at various depths in the canopy and their genotype determined to test for differences in leaf biomass allocation, leaf characteristics and the resulting light capture, calculated through a canopy model using the actual vertical light and leaf area profiles. Light capture was related to biomass to determine whether light competition between genotypes was asymmetric.
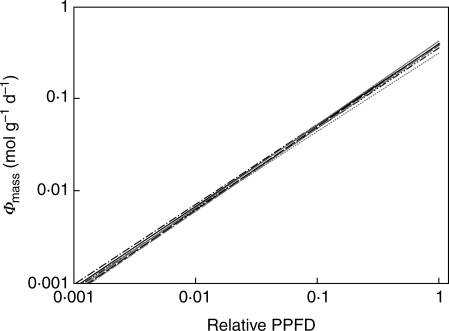
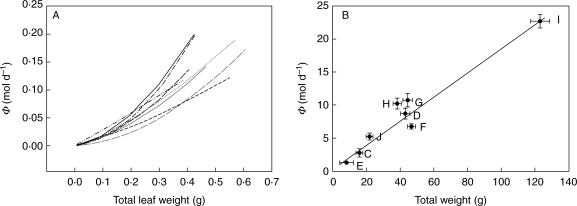
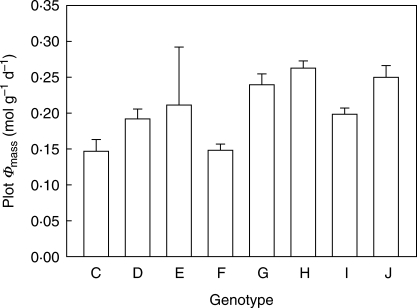
Key results: All genotypes could reach the top of the canopy. The genotypes differed in morphology, but did not differ significantly in light capture per unit mass (Phi(mass)) for leaves with the laminae placed at the same light levels. Light capture did increase disproportionately with leaf mass for all genotypes. However, the more abundant genotypes did not capture disproportionately more light relative to their mass than less-abundant genotypes.
Conclusions: Vertical niche differentiation in light acquisition does not appear to be a factor that could promote coexistence between these genotypes. Contrary to what is generally assumed, light competition among genetic individuals of the same species was size-symmetric, even if taller individual leaves did capture disproportionately more light. The observed shifts in genotype frequency cannot therefore be explained by asymmetric competition for light.
Figures
References
-
- Aan A, Hallik L, Kull O. Photon flux partitioning among species along a productivity gradient of an herbaceous plant community. Journal of Ecology. 2006;94:1143–1155.
-
- Aerts R. Interspecific competition in natural plant communities: mechanisms, trade-offs and plant-soil feedbacks. Journal of Experimental Botany. 1999;50:29–37.
-
- Anten NPR, Hirose T. Biomass allocation and light partitioning among dominant and subordinate individuals in Xanthium canadense stands. Annals of Botany. 1998;82:665–673.
-
- Anten NPR, Hirose T. Limitations on photosynthesis of competing individuals in stands and the consequences for canopy structure. Oecologia. 2001;129:186–196. - PubMed
