

Comparison of SNR and CNR for in vivo mouse brain imaging at 3 and 7 T using well matched scanner configurations
- PMID: 18841848
- PMCID: PMC2809704
- DOI: 10.1118/1.2968092
Comparison of SNR and CNR for in vivo mouse brain imaging at 3 and 7 T using well matched scanner configurations
Abstract
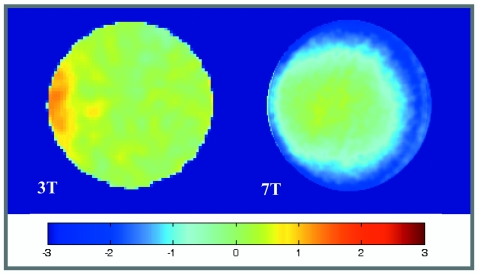
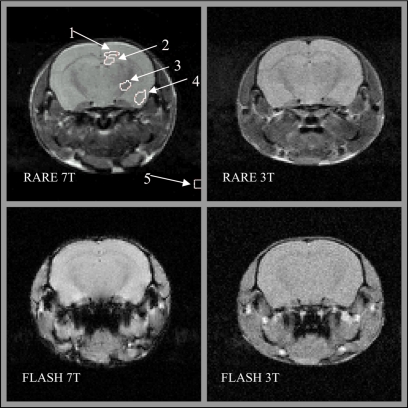
Signal-to-noise ratio (SNR) and contrast-to-noise ratio (CNR) for magnetic resonance microimaging were measured using two nearly identical magnetic resonance imaging (MRI) scanners operating at field strengths of 3 and 7 T. Six mice were scanned using two imaging protocols commonly applied for in vivo imaging of small animal brain: RARE and FLASH. An accounting was made of the field dependence of relaxation times as well as a small number of hardware disparities between scanner systems. Standard methods for relaxometry were utilized to measure T1 and T2 for two white matter (WM) and two gray matter (GM) regions in the mouse brain. An average increase in T1 between 3 and 7 T of 28% was observed in the brain. T2 was found to decrease by 27% at 7 T in agreement with theoretical models. The SNR was found to be uniform throughout the mouse brain, increasing at higher field by a factor statistically indistinguishable from the ratio of Larmor frequencies when imaging with either method. The CNR between GM and WM structures was found to adhere to the expected field dependence for the RARE imaging sequence. Improvement in the CNR for the FLASH imaging sequence between 3 and 7 T was observed to be greater than the Larmor ratio, reflecting a greater susceptibility to partial volume effects at the lower SNR values at 3 T. Imaging at 7 T versus 3 T in small animals clearly provides advantages with respect to the CNR, even beyond the Larmor ratio, especially in lower SNR regimes. This careful multifaceted assessment of the benefits of higher static field is instructive for those newly embarking on small animal imaging. Currently the number of 7 T MRI scanners in use for research in human subjects is increasing at a rapid pace with approximately 30 systems deployed worldwide in 2008. The data presented in this article verify that if system performance and radio frequency uniformity is optimized at 7 T, it should be possible to realize the expected improvements in the CNR and SNR compared with MRI at 3 T.
Figures
References
-
- Chen C.-N. and Hoult D. I., Biomedical Magnetic Resonance Technology (Adam Hilger, New York, 1989).
-
- Jezzard P., Duewell S., and Balaban R. S., “MR relaxation times in human brain: Measurement at 4 T,” Radiology 199, 773–779 (1996). - PubMed
Publication types
MeSH terms
Grants and funding
LinkOut - more resources
Full Text Sources
Medical
