Review
. 2008 Nov 13;112(45):14108-23.
doi: 10.1021/jp805876e. Epub 2008 Oct 9.

Proton-coupled electron transfer in solution, proteins, and electrochemistry

Affiliations
Review

Proton-coupled electron transfer in solution, proteins, and electrochemistry

Sharon Hammes-Schiffer et al. J Phys Chem B. .

Abstract

Recent advances in the theoretical treatment of proton-coupled electron transfer (PCET) reactions are reviewed. These reactions play an important role in a wide range of biological processes, as well as in fuel cells, solar cells, chemical sensors, and electrochemical devices. A unified theoretical framework has been developed to describe both sequential and concerted PCET, as well as hydrogen atom transfer (HAT). A quantitative diagnostic has been proposed to differentiate between HAT and PCET in terms of the degree of electronic nonadiabaticity, where HAT corresponds to electronically adiabatic proton transfer and PCET corresponds to electronically nonadiabatic proton transfer. In both cases, the overall reaction is typically vibronically nonadiabatic. A series of rate constant expressions have been derived in various limits by describing the PCET reactions in terms of nonadiabatic transitions between electron-proton vibronic states. These expressions account for the solvent response to both electron and proton transfer and the effects of the proton donor-acceptor vibrational motion. The solvent and protein environment can be represented by a dielectric continuum or described with explicit molecular dynamics. These theoretical treatments have been applied to numerous PCET reactions in solution and proteins. Expressions for heterogeneous rate constants and current densities for electrochemical PCET have also been derived and applied to model systems.


Figures
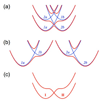
Figure 1
Figure 1
(a) Diabatic and adiabatic electronic states as functions of the proton coordinate. The diabatic states (blue) are labeled 1a, 1b, 2a, and 2b. The adiabatic states (red) are obtained by diagonalizing the 4×4 Hamiltonian matrix in the basis of the four diabatic states. (b) Two pairs of diabatic states 1a/1b and 2a/2b and associated electronic states obtained by block diagonalization of the 1a/1b and 2a/2b blocks of the 4×4 Hamiltonian matrix. The diabatic states are labeled as in part (a) and are shown in blue, while the electronic states obtained by block diagonalization are shown in red. (c) The two ground electronic states from part (b) are the reactant (I) and product (II) diabatic states for the overall PCET reaction.
Figure 2
Figure 2
Pair of two-dimensional vibronic free energy surfaces as functions of two collective solvent coordinates for a PCET reaction. The lowest energy reactant (I) and product (II) free energy surfaces are shown. The free energy difference ΔGμv0 and outer-sphere reorganization energy λ µvare indicated. Figure reproduced with permission from Ref. .
Figure 3
Figure 3
Slices of the free energy surfaces for the ground reactant (I) and product (II) vibronic states along a collective solvent coordinate. The proton potential energy curves along the proton coordinate and the corresponding ground state proton vibrational wavefunctions are depicted for the reactant minimum, the crossing point, and the product minimum of the free energy curves. The energies of these proton vibrational states correspond to the open circles on the free energy curves. The proton potential energy curves associated with the crossing point are shifted higher in energy for clarity.
Figure 4
Figure 4
Free energy surfaces for the PCET reaction in a rhenium-tyrosine complex. In the center frame are slices of the free energy surfaces along a collective solvent coordinate. In the left frame is the reactant (I) proton potential energy curve and the corresponding proton vibrational wavefunctions along the proton coordinate evaluated at the minimum of the ground state reactant free energy surface. In the right frame is the product (II) proton potential energy curve and the corresponding proton vibrational wavefunctions along the proton coordinate evaluated at the minimum of the ground state product free energy surface. Figure reproduced with permission from Ref. .
Figure 5
Figure 5
The singly occupied molecular orbital (SOMO) for (a) the phenoxyl/phenol and (b) the benzyl/toluene system for the transition state structures. Figure reproduced with permission from Ref. .
Figure 6
Figure 6
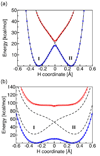
State-averaged CASSCF ground and excited state electronically adiabatic potential energy curves along the transferring hydrogen coordinate for (a) the phenoxyl/phenol and (b) the benzyl/toluene system. The coordinates of all nuclei except the transferring hydrogen correspond to the transition state geometry. The CASSCF results are depicted as open circles that are blue for the ground state and red for the excited state. The black dashed lines represent the diabatic potential energy curves corresponding to the two localized diabatic states I and II. The mixing of these two diabatic states with the electronic coupling V el leads to the CASSCF ground and excited state electronically adiabatic curves depicted with solid colored lines following the colored open circles. For the phenoxyl/phenol system, the solid colored lines and the black dashed lines are nearly indistinguishable because the adiabatic and diabatic potential energy curves are virtually identical except in the transition state region. Figure reproduced with permission from Ref. .
Figure 7
Figure 7
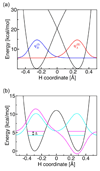
(a) Diabatic potential energy curves corresponding to the two localized diabatic states I and II and the corresponding proton vibrational wavefunctions φμ(I) (blue) and φν(II) (red) for the phenoxyl/phenol system. Since this reaction is electronically nonadiabatic, the vibronic coupling is the product of the electronic coupling V el and the overlap of the reactant and product proton vibrational wavefunctions Sμνφμ(I)|φν(II). (b) Electronically adiabatic ground state potential energy curve and the corresponding proton vibrational wavefunctions for the benzyl/toluene system. Since this reaction is electronically adiabatic, the vibronic coupling is equal to half of the energy splitting Δ between the symmetric (cyan) and antisymmetric (magenta) proton vibrational states for the electronic ground state potential energy surface. For illustrative purposes, the excited vibrational state is shifted up in energy by 0.8 kcal/mol. Figure reproduced with permission from Ref. .
Figure 8
Figure 8
PCET comproportionation reactions in ruthenium polypyridyl complexes.
Figure 9
Figure 9
Structure of the rhenium-tyrosine complex2 hydrogen bonded to a phosphate HPO4 2− acceptor. The proton transfer and electron transfer reactions are indicated with arrows. Figure reproduced with permission from Ref. .
Figure 10
Figure 10
pH-dependence of the overall rate constant k q for the rhenium-tyrosine complex in H2O and D2O. The experimental data for k q measured with 10mM phosphate buffer in H2O (Figure 3 in Ref. 2) are depicted with open circles (○). The rate constants for the phosphate-acceptor model with 10mM phosphate buffer calculated using Eq. (13) are depicted with blue and red lines for the reaction in H2O and D2O, respectively. The rate constant for the reaction in H2O or D2O is plotted as a function of pH or pD, respectively, where the mole fraction χ(HPO42) or χ(DPO42) is calculated as a function of pH or pD with pKa = 7.2 or 7.8, respectively. Figure reproduced in color with permission from Ref. .
Figure 11
Figure 11
The hydrogen abstraction step of the reaction catalyzed by soybean lipoxygenase with its natural substrate linoleic acid. In this step, a hydrogen is abstracted from the linoleic acid to the iron cofactor. Figure reproduced with permission from Ref..
Figure 12
Figure 12
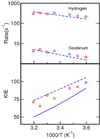
Temperature dependence of the rates and KIE for soybean lipoxygenase. The dashed lines depict the rates and KIE obtained with Eq. (2) in conjunction with the multistate continuum theory. The solid line depicts the temperature dependence of the KIE obtained with Eq. (7) in conjunction with molecular dynamics simulations of the entire solvated enzyme to obtain the solvent reorganization energy and the average value and frequency of the R coordinate, as well as quantum calculations on a model system to obtain the vibronic coupling parameters. The experimental data are depicted with circles. The theoretical data were obtained from Ref. and .
Figure 13
Figure 13
Schematic picture of the electrochemical PCET reaction system comprised of a solute complex near the surface of a metal electrode in solution. The electron transfers from the electron donor De of the solute complex to the electrode, and the proton transfers from Dp to Ap within the solute complex. Filled circles represent the ions of the supporting electrolyte in the solvent, φM is the inner potential of the electrode, φ S(x) is the electrostatic potential in solution at a distance x from the electrode surface, x H is the distance to the outer Helmholtz plane (OHP), and R is the proton donor-acceptor distance within the solute complex. Figure reproduced with permission from Ref. .
Figure 14
Figure 14
Logarithm of the scaled current density as a function of overpotential at T=300 K for a model electrochemical PCET system. The solid red and dashed blue curves correspond to δR= 0.05 Å and δR= 0, respectively. Data obtained from Ref. .

Similar articles

Cited by

References

    1. Roberts JA, Kirby JP, Nocera DG. Journal of the American Chemical Society. 1995;117:8051.
    1. Reece SY, Nocera DG. Journal of the American Chemical Society. 2005;127:9448. - PubMed
    1. Rosenthal J, Nocera DG. Accounts of Chemical Research. 2007;40:543. - PubMed
    1. Irebo T, Reece SY, Sjodin M, Nocera DG, Hammarstrom L. Journal of the American Chemical Society. 2007;129:15462. - PubMed
    1. Sjodin M, Styring S, Akermark B, Sun L, Hammarstrom L. Journal of the American Chemical Society. 2000;122:3932.

Publication types