Comparative Study
. 2008 Oct 8:9:463.
doi: 10.1186/1471-2164-9-463.

Preferred and avoided codon pairs in three domains of life

Affiliations
Comparative Study

Preferred and avoided codon pairs in three domains of life

Age Tats et al. BMC Genomics. .

Abstract

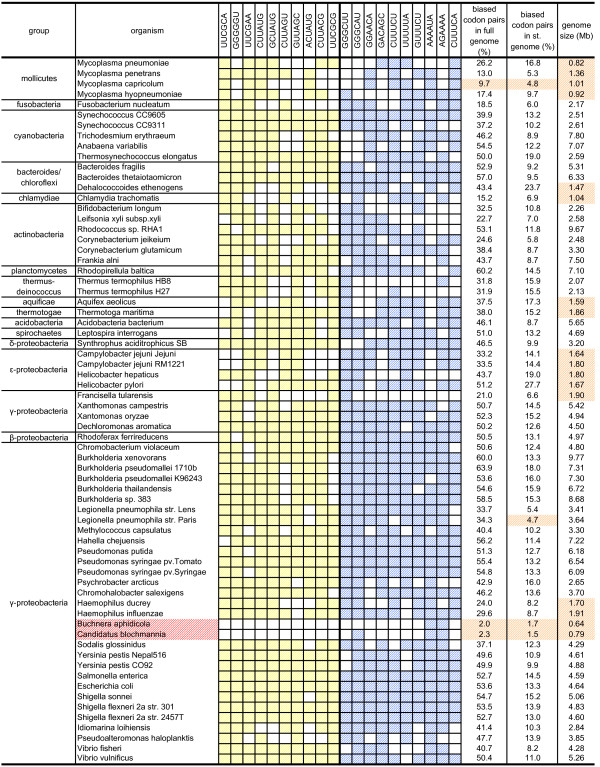
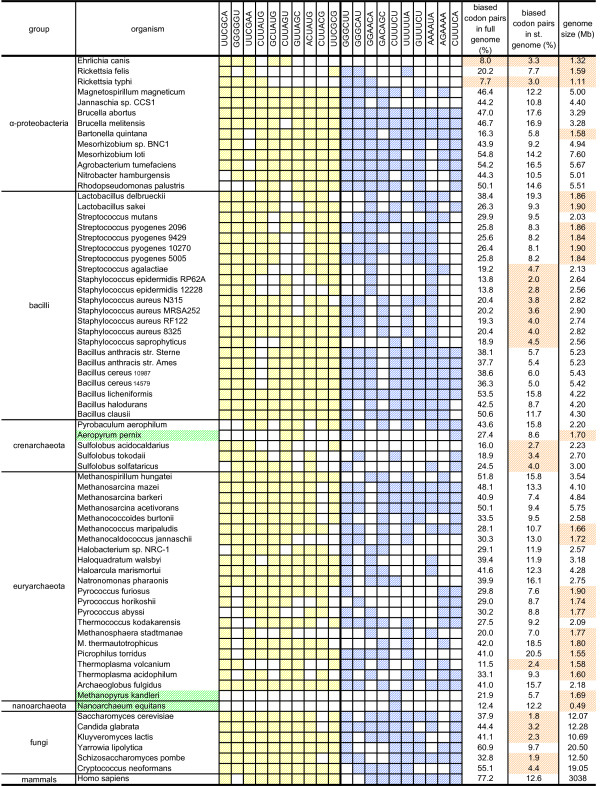
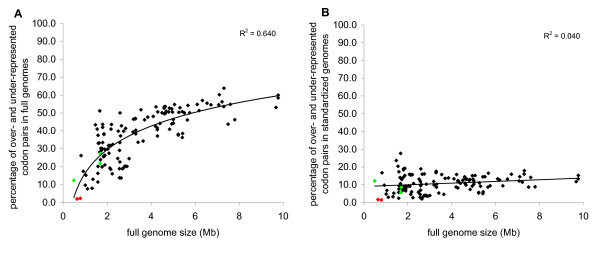
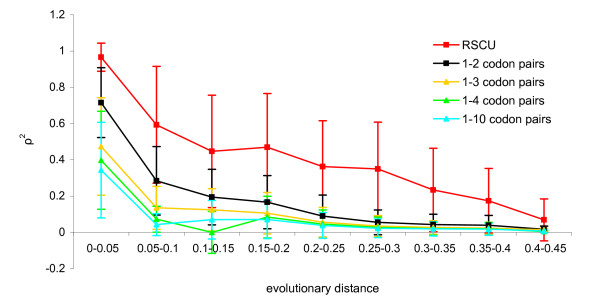
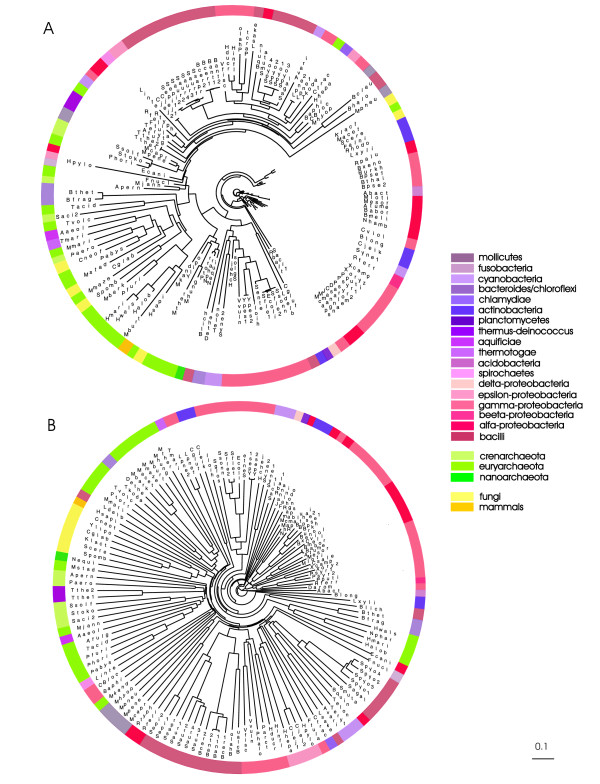
Background: Alternative synonymous codons are not used with equal frequencies. In addition, the contexts of codons - neighboring nucleotides and neighboring codons - can have certain patterns. The codon context can influence both translational accuracy and elongation rates. However, it is not known how strong or conserved the codon context preferences in different organisms are. We analyzed 138 organisms (bacteria, archaea and eukaryotes) to find conserved patterns of codon pairs.

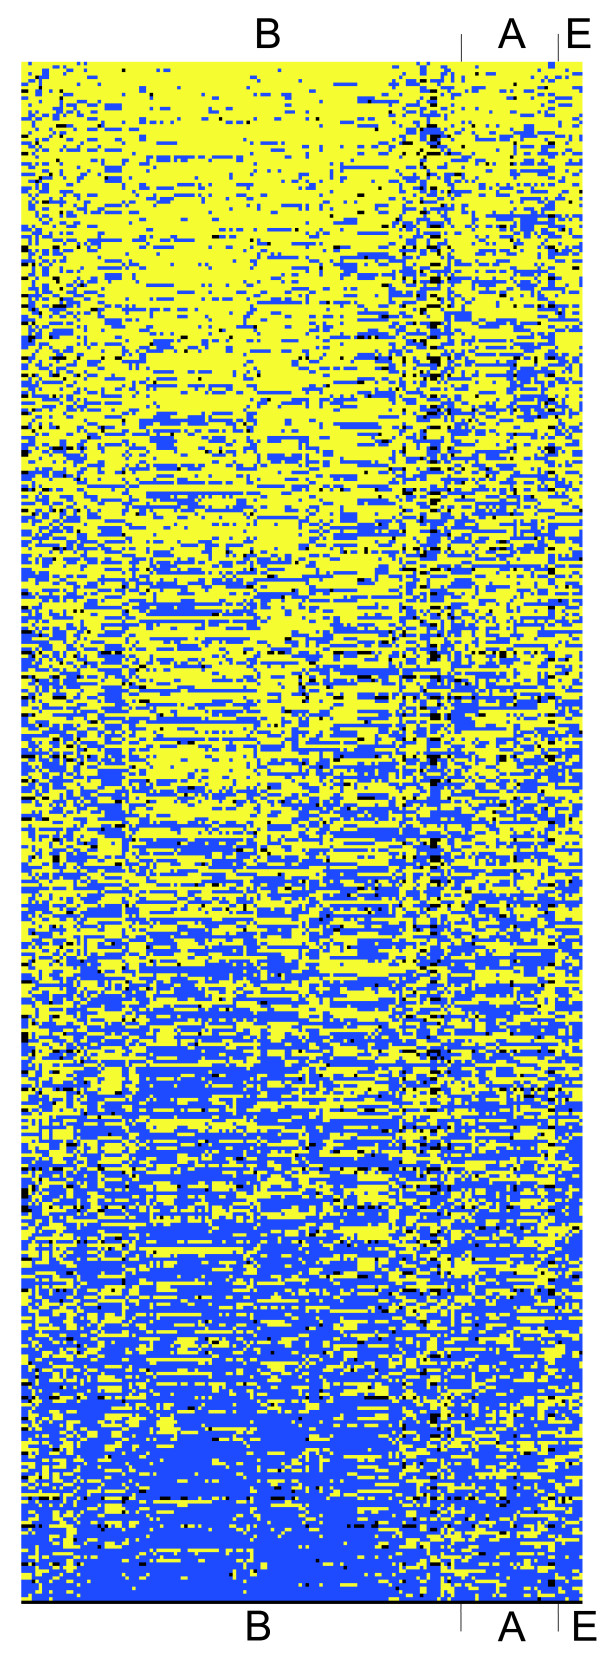
Results: After removing the effects of single codon usage and dipeptide biases we discovered a set of neighboring codons for which avoidances or preferences were conserved in all three domains of life. Such biased codon pairs could be divided into subtypes on the basis of the nucleotide patterns that influence the bias. The most frequently avoided type of codon pair was nnUAnn. We discovered that 95.7% of avoided nnUAnn type patterns contain out-frame UAA or UAG triplets on the sense and/or antisense strand. On average, nnUAnn codon pairs are more frequently avoided in ORFeomes than in genomes. Thus we assume that translational selection plays a major role in the avoidance of these codon pairs. Among the preferred codon pairs, nnGCnn was the major type.

Conclusion: Translational selection shapes codon pair usage in protein coding sequences by rules that are common to all three domains of life. The most frequently avoided codon pairs contain the patterns nnUAnn, nnGGnn, nnGnnC, nnCGCn, GUCCnn, CUCCnn, nnCnnA or UUCGnn. The most frequently preferred codon pairs contain the patterns nnGCnn, nnCAnn or nnUnCn.


Figures

Figure 1
Figure 1
The most avoided and the most preferred codon pairs are uniformly distributed in all three domains of life. The map is clustered on the basis of the conservation of avoidance and preference of different codon pairs. The avoided codon pairs are marked in yellow (obs/exp < 0). The preferred codon pairs are marked in blue (obs/exp > 0). Codon pairs without bias are black (obs/exp = 0). No additional criteria were applied to the figure. Codon pairs are ranked downwards according to the decreasing conservation of avoided codon pairs in the organisms studied. B – bacteria, A – archaea, E – eukaryotes.
Figure 2
Figure 2
The distribution of the top ten significantly under-represented and the top ten significantly over-represented codon pairs in the organisms studied. The colored cells mark significant bias of the pattern in the corresponding organisms (observed/expected ≤ 0.90 (yellow) or observed/expected ≥ 1.10 (blue), p-value ≤ 0.01). Names of organisms with fewer than five biased codon pairs out of 20 are colored red. The percentages of biased codon pairs in full genomes and in standardized genomes and genome sizes are also shown. Yellow shaded cells – less than 10% of biased codon pairs in full genomes; less than 5% of biased codon pairs in standardized genomes; genomes smaller than 2 Mb. st. genome – standardized genome.
Figure 3
Figure 3
The distribution of the top ten significantly under-represented and the top ten significantly over-represented codon pairs in the organisms studied (continuation of Figure 2). The colored cells mark significant bias of the pattern in the corresponding organisms (observed/expected ≤ 0.90 (yellow) or observed/expected ≥ 1.10 (blue), p-value ≤ 0.01). Names of organisms having fewer than five biased codon pairs out of 20 are colored green. The percentages of biased codon pairs in full genomes and in standardized genomes and genome sizes are also shown. Yellow shaded cells – less than 10% of biased codon pairs in full genomes; less than 5% of biased codon pairs in standardized genomes; genomes smaller than 2 Mb. st. genome – standardized genome.
Figure 4
Figure 4
The effect of genome size on the fraction of biased codon pairs. A – the percentage of biased codon pairs in full bacterial genomes. B – the percentage of biased codon pairs in standardized bacterial genomes. Green diamonds – Aeropyrum pernix, Methanopyrus kandleri and Nanoarchaeum equitans. Red diamonds – Buchnera aphidicola and Candidatus blochmannia pensilvanicus.
Figure 5
Figure 5
Correlation of codon usage and codon context usage in bacteria. RSCU – relative synonymous codon usage; 1–2 – neighboring codon pairs; 1–3 – codons separated by one intervening codon; 1–4 – codons separated by two intervening codons; 1–10 – codons separated by eight intervening codons. Evolutionary distances between bacteria were retrieved as a 16SRNA distance matrix from the Ribosomal Database Project [28]. ρ2 – Spearman's correlation coefficient.
Figure 6
Figure 6
The evolutionary conservation of RSCU (A) and RDCU (B) in the genomes studied. The branch lengths characterize the correlation of RSCU or RDCU usage between two organisms – the higher the correlation, the shorter the branch. In general, the branch lengths of the RSCU tree are shorter than those of the RDCU tree, showing stronger similarity of codon usage than codon pair usage between different organisms. Bacilli, gamma-proteobacteria and alpha-proteobacteria form very similar clusters on both trees. Eukaryotes, which are spread around the RSCU tree, are all clustered together in the RDCU tree. For the full names of organisms see [additional file 6].

References

    1. Irwin B, Heck JD, Hatfield GW. Codon pair utilization biases influence translational elongation step times. J Biol Chem. 1995;270:22801–22806. doi: 10.1074/jbc.270.39.22801. - DOI - PubMed
    1. Murgola EJ, Pagel FT, Hijazi KA. Codon context effects in missense suppression. J Mol Biol. 1984;175:19–27. doi: 10.1016/0022-2836(84)90442-X. - DOI - PubMed
    1. Bossi L, Ruth JR. The influence of codon context on genetic code translation. Nature. 1980;286:123–127. doi: 10.1038/286123a0. - DOI - PubMed
    1. Miller JH, Albertini AM. Effects of surrounding sequence on the suppression of nonsense codons. J Mol Biol. 1983;164:59–71. doi: 10.1016/0022-2836(83)90087-6. - DOI - PubMed
    1. Kopelowitz J, Hampe C, Goldman R, Reches M, Engelberg-Kulka H. Influence of codon context on UGA suppression and readthrough. J Mol Biol. 1992;225:261–269. doi: 10.1016/0022-2836(92)90920-F. - DOI - PubMed

Publication types

LinkOut - more resources